Editors’ Highlights are summaries of recent papers by AGU’s journal editors.
Sources: Geophysical Research Letters and Atmospheric Chemistry and Physics
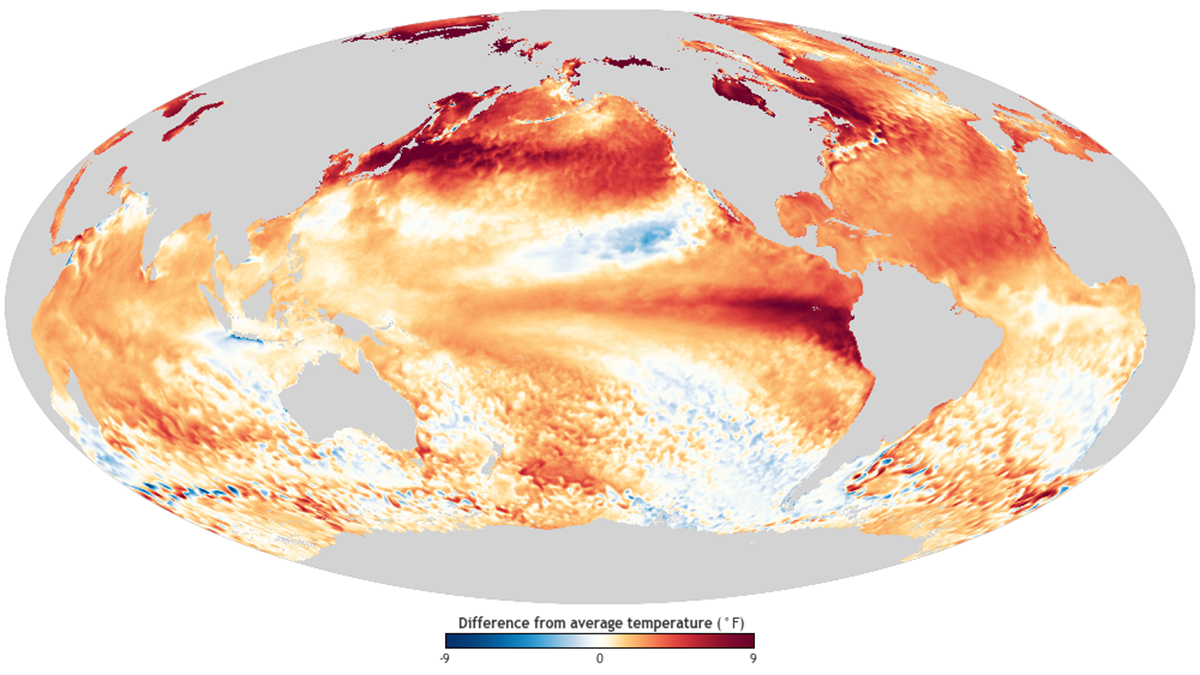
Earth’s average surface temperature has risen by about 1° Celsius over the past half century. While the upward trend is unrelenting, dips and spikes along the way are common due to natural climatic anomalies. The spike in global temperature in 2023 was especially large, breaking the previous record by nearly 0.2°Celsius. This motivated several researchers including Huang et al. [2024], Jiang et al. [2025] and Raghuraman et al. [2024] to dig into the mechanisms.
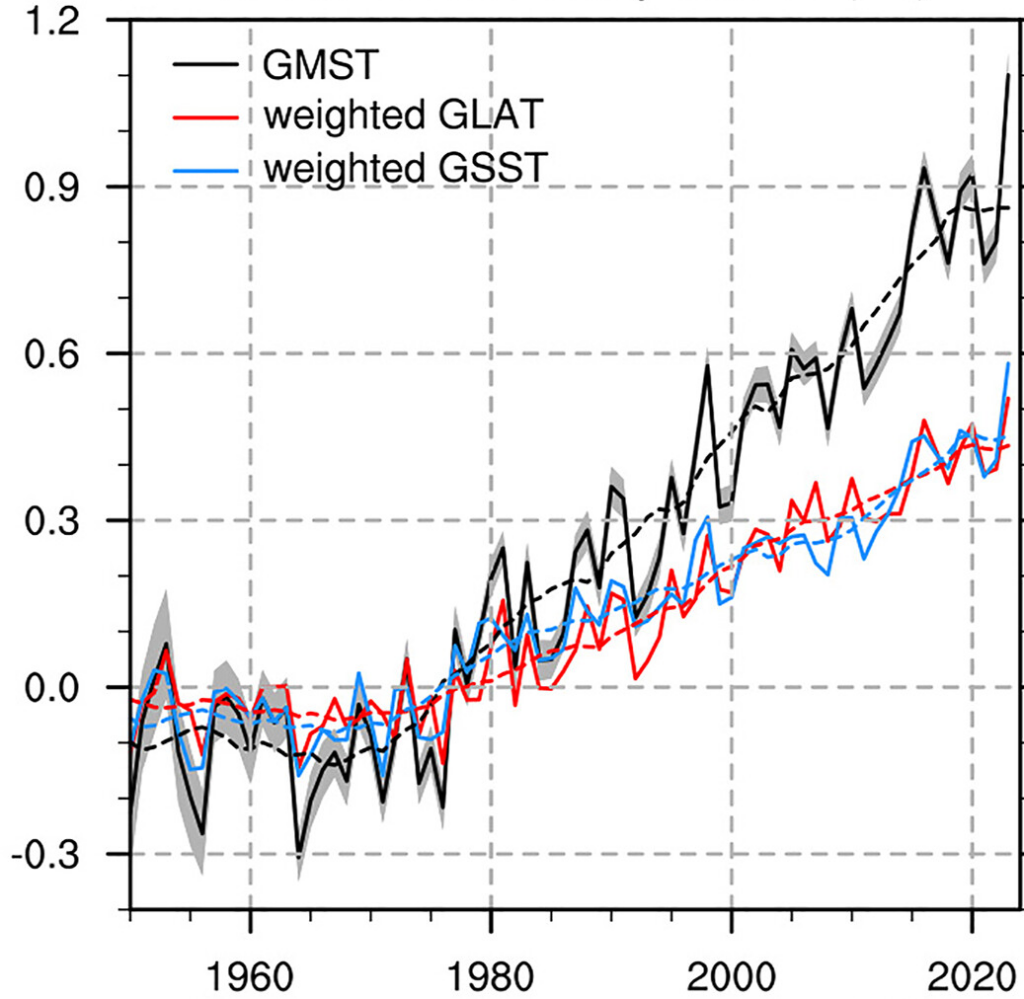
All three point in different ways to El Niño and La Niña—temporary warming and cooling events in the tropical Pacific Ocean that occur every few years. Huang et al. [2024] used global observations of sea surface temperature to uncover the ocean’s role in the record heat of 2023, including a transition from a long-lasting La Niña to El Niño. Jiang et al. [2025] showed how El Niño’s far-reaching impact on seasonal climate anomalies—especially over North America—helped extend the global warming spike further across the year. Applying statistical analysis to a broad suite of global climate model simulations, Raghuraman et al. [2024] confirmed that even in a world without carbon emissions, one-off spikes in global temperature just as large as that seen in 2023 are to be expected during El Niño years, and even more so when preceded by a long-lasting La Niña.
These studies underscore the importance of understanding how short-term, regional climate variability, such as El Niño, interacts with the relentless march of global warming to produce extreme global events like that of 2023.
Citations
Huang, B., Yin, X., Carton, J. A., Chen, L., Graham, G., Hogan, P., et al. (2024). Record high sea surface temperatures in 2023. Geophysical Research Letters, 51, e2024GL108369. https://doi.org/10.1029/2024GL108369
Jiang, N., Zhu, C., Hu, Z-Z., McPhaden, M. J., Lian, T., Zhou, C., Qian, W., and Chen, D. (2025) El Niño and sea surface temperature pattern effects lead to historically high global mean surface temperatures in 2023. Geophysical Research Letters, e 2024GL113733. https://doi.org/10.1029/2024GL113733
Raghuraman, S. P., Soden, B., Clement, A., Vecchi, G., Menemenlis, S., and Yang, W. (2024). The 2023 global warming spike was driven by the El Niño–Southern Oscillation. Atmospheric Chemistry and Physics, 24, 11275–11283, https://doi.org/10.5194/acp-24-11275-2024
—Kris Karnauskas, Editor-in-Chief, Geophysical Research Letters