Source: Journal of Geophysical Research: Space Physics
The thermosphere is a region of near-space from approximately 100 to 1000 kilometers in altitude. It’s where low altitude Earth-orbiting satellites operate providing critical information about the state of our planet.
The thermosphere has weather and climate akin to that observed at the Earth’s surface. There are periods, typically of a few days, when the weather is relatively quiescent, and other times with storms, the origin of which can be traced back to disturbances on the Sun. The density of the thermosphere at approximately 400 kilometers in altitude can change by an order of magnitude between quiet and disturbed conditions, and the winds can reach 1 kilometer per second. Superposed on these global-scale variations are a wide variety of smaller-scale perturbations resulting from atmospheric tides, and planetary and gravity waves mainly generated in the troposphere and stratosphere. The ever-changing winds affect the drag experienced by satellites, thus impacts on their lifetime.
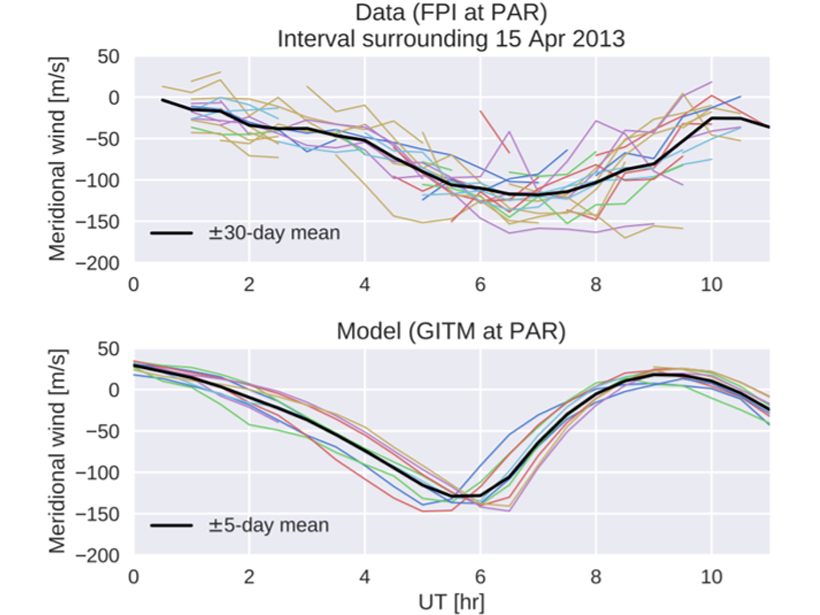
Much like in the lower atmosphere, weather in the upper atmosphere is harder to predict. Physics-based models are now sophisticated enough to reproduce many features of the climate of the thermosphere. Harding et al. [2019] present the first evaluation of how well one particular model, GITM, characterizes the weather. To evaluate the model, they compare it with a year of data from six ground-based sites that observe thermospheric winds. They calculate statistics of the weather, such as the decorrelation time, i.e. how long weather fluctuations persist (1.8 hours in the data and 1.9 hours in the model). They also calculate the spatial decorrelation by comparing weather at different sites. The model shows that the weather is similar over a much wider area than the data. The modeled correlation of sites 790 km apart is 0.8; the corresponding value for observations is 0.4,
In terms of being able to predict a weather fluctuation on a particular day, the model performs poorly, with a correlation that is near zero at the low latitude sites, but slightly better at the mid latitude sites where the source that most likely dominates the space weather in the thermosphere is heating in the auroral zone. To increase the accuracy of the weather produced by thermosphere models further, higher resolution models and/or improved parameterization of wave sources will be required.
Citation: Harding, B. J., Ridley, A. J., & Makela, J. J. [2019]. Thermospheric weather as observed by ground‐based FPIs and modeled by GITM. Journal of Geophysical Research: Space Physics, 124. https://doi.org/10.1029/2018JA026032
—Alan Rodger, Editor, JGR: Space Physics
Text © 2019. The authors. CC BY-NC-ND 3.0
Except where otherwise noted, images are subject to copyright. Any reuse without express permission from the copyright owner is prohibited.

