
On 21 July 1983 the lowest temperature ever observed on Earth was recorded at a Russian research station in central Antarctica: The thermometer at the site read −89.2°C (−128.6°F).
In the face of climate change, researchers have begun to investigate how warm the planet’s southernmost region can get.
But it’s not just the lowest lows that have caught the attention of scientists in the Antarctic. Especially in the face of climate change, researchers have also begun to investigate how warm the planet’s southernmost region can get.
Officially investigating, documenting, and verifying such high-temperature extremes is the business of the World Meteorological Organization (WMO) Commission for Climatology (CCl). For this purpose, the WMO CCl has created an international evaluation committee of climatologists and meteorologists associated with Antarctic temperature measurements to establish the highest-temperature extremes of the region.
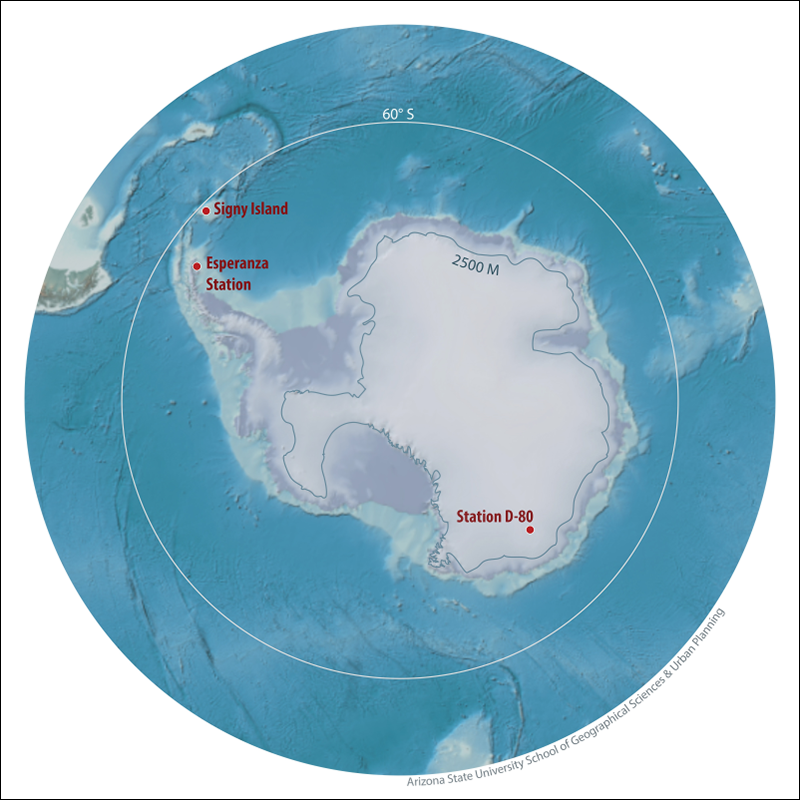
Their investigation verified what is, as of now, the current record high: a balmy 19.8°C (67.6°F). This temperature was observed on 30 January 1982 at Signy Research Station at Factory Cove, Borge Bay, on Signy Island. This record, collected with instruments that follow WMO’s standards, has now been made public by WMO.

Also public as of today are two temperature extremes in two distinct climate regimes of Antarctica: its low-lying ice sheet and continent and its high and dry plateau. On the continent, CCl verified that a high-temperature extreme of 17.5°C (63.5°F) occurred on 24 March 2015 at the Argentine research base Esperanza, located near the northern tip of the Antarctic Peninsula. An observation of −7.0°C (19.4°F), made on 28 December 1989 at an automatic weather station (AWS) site, D-80, located inland of the Adélie Coast, has been verified by CCl to be the highest temperature recorded on the Antarctic Plateau.
The committee noted that the extremes at the Signy, Esperanza, and D-80 stations occurred during periods of warm air advection. At Signy and Esperanza, warming from leeward winds (foehn warming) also contributed, whereas at D-80 solar heating under clear skies at high elevation was a major contributory factor. This investigation highlights the need to continually monitor all of the Antarctic region to ensure that we have the best possible data for climate change analysis at both the regional and global scales.
Highest Temperature for the Antarctic Region: 19.8°C, Signy Research Station, 30 January 1982
Knowledge and verification of extreme temperatures is important in the study of global and regional climate change. It’s also key in the analysis of observation practices and proper equipment selection. Similar to how WMO has documented extremes for other regions of the world during the past 10 years, an evaluation committee recently finished its examination of record high extremes for the Antarctic region.
But what exactly is the Antarctic region? The WMO Antarctic temperature extremes committee recommended that “Antarctic region” be defined as “all of the land and ice shelves south of 60°S latitude.”
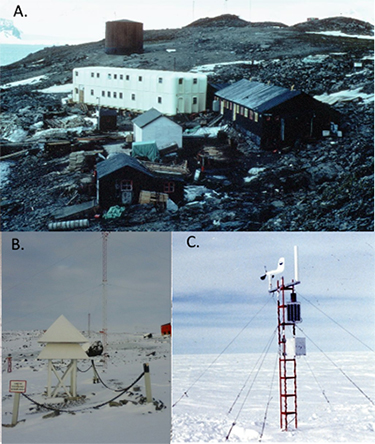
The committee then examined the evidence for establishing the highest temperature of the region as 19.8°C (67.6°F), observed on 30 January 1982 at Signy Research Station (60°43′S, 45°36′W, WMO station 88925) at Factory Cove, Borge Bay. Signy Research Station is situated on the eastern shore of Signy Island (Figure 1). The research station was established in 1947 and operated as a year-round station until 1996, when it reduced to summer-only operation. Figure 2a shows a photograph of the station in 1967.
At the time of the record observation, the Signy Research Station was operating a very basic climatological observing program. There were no dedicated meteorological observers at the station, and biological research assistants carried out the observations. These assistants carried out full synoptic observation at 09:00 local time (12:00 coordinated universal time (UTC)) every day. Additionally, the assistants collected maximum and minimum thermometers readings at 09:00 and 21:00 local time (12:00 and 00:00 UTC, respectively). The station used mercury-in-glass thermometers located in a Stevenson screen shelter. At 12:00 UTC every day, a duty assistant changed the mercury-in-steel distant-reading thermometer that provided a continuous record of temperature on a circular chart.
Between 25 and 27 January 1982, 12:00 UTC temperatures registered just above freezing but rose on and after 28 January. On 30 January the 12:00 UTC temperature read +9.6°C, and the maximum thermometer reading over the past 12 hours was logged as +19.8°C (67.6°F), a record for Signy Research Station.
Weather Conditions During the High-Temperature Extreme
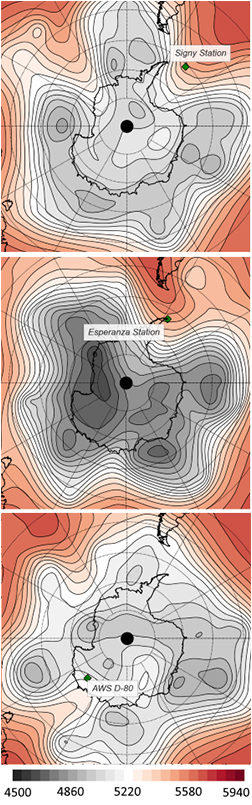
At the time of the observed record temperature, a trough of low surface pressure lay across the Drake Passage, connecting low-pressure centers to the west of the Antarctic Peninsula and to the west of southern Chile. Simultaneously, a ridge of high pressure extending southward from the South Atlantic drove a strong northwesterly pattern of circulation in the vicinity of the South Orkney Islands. This can be seen in the European Centre for Medium-Range Weather Forecasts’ ERA-Interim reanalysis [Dee et al., 2011], one of the top computer model reconstructions of the weather of the last 150 years (Figure 3a). This flow resulted in the southward movement of warm midlatitude air from the South Atlantic sector.
Although this advection of warm air was almost certainly a necessary condition for achieving these record temperatures, it is likely that local orographic effects also played a role. Signy lies in the lee of Coronation Island when the wind flows from the northwest. The island rises to 1265 meters and may thus cause a significant foehn warming effect. The distant-reading thermometer record shows a rapid increase in temperature around 21:00 local time and a rapid decrease at around 02:30, both of which are characteristic of foehn events.
Additionally, the hygrograph record shows two very rapid decreases in humidity on 29 January, the first around 09:00 local time and the second around 21:00, which would support the idea that a foehn effect played an important role. Although the anemograph does not show particularly marked wind speed changes at these times, there is a transition from almost calm conditions to very gusty, moderate winds at around 22:30 local time on 29 January, followed by a dramatic increase in wind speed at around 02:30 local time on 30 January.
Past researchers have noted the importance of the foehn in driving Antarctica warm events [e.g., Elvidge and Renfrew, 2016; Cape et al., 2015; Speirs et al., 2010]. Consequently, after the committee assessed the station’s compliance with WMO standards, as well as foehn occurrence, it unanimously recommended acceptance of this observation as the highest temperature recorded for the Antarctic Region.
Defining Subregions
Following the acceptance of the Signy observation of 19.8°C as the highest temperature recorded in the Antarctic region (all lands south of 60°S), the committee addressed the concern that such an acceptance of an island observation measured at 60°43′S does not match the common geographic interpretation of the Antarctic as a single landmass. One important goal the committee wished to address was the improvement of public education about the Antarctic’s quite distinct climatic regimes. Most of the general public is often surprised to learn how mild some parts of the Antarctic can be.
Consequently, the committee recommended two new subregional temperature extremes: (1) the highest temperature recorded on, or immediately adjacent to, the Antarctic continent and (2) the highest temperature recorded at or above 2500 meters (the interior plateau region of the Antarctic).
Highest Temperature on the Continent: 17.5°C, Esperanza Research Base, 24 March 2015
The committee evaluated the evidence for an observation of 17.5°C (63.5°F) made on 24 March 2015 at the Argentine research base Esperanza. If verified, this reading would be the highest temperature recorded on the Antarctic continent.
Most of the general public is often surprised to learn how mild some parts of the Antarctic can be.
Esperanza is located near the northern tip of the Antarctic Peninsula just to the east of the Antarctic Peninsula mountains, which rise to around 1000 meters near this location (Figure 1). This temperature extreme occurred on the day following a reading of 17.4°C (63.3°F) measured at the Argentine research base Marambio, about 100 kilometers southeast of Esperanza, on 23 March 2015.
Temperature observations for Esperanza Station (63°24′S, 56°59′W, elevation of 13 meters) began in January of 1953 and have continued since. The instrumentation consists of a common (mercury-in-glass) maximum/minimum thermometer that was installed on 3 December 2005 located within a pagoda-style naturally vented meteorological shelter. Figure 2b shows a photograph of the instrumental shelter in 2016.
ERA reanalysis for this location at the time of the temperature extreme shows a northwest–southeast warm high-pressure ridge stretching from South America to the Antarctic Peninsula in concert with a cold trough of low pressure lying over the far South Pacific near 120°W. Together, these features drove a strong northwesterly circulation that was associated with warm air advection and strong winds perpendicular to the mountain chain in the northern part of the peninsula, conducive to the development of a foehn at Esperanza (Figure 3b).
Consequently, after careful evaluation of the evidence with regard to quality of observation, type and calibration of equipment, and site placement, as well as foehn occurrence, the committee recommended unanimously to accept the observation of 17.5°C (63.5°F) made on 24 March 2015 at the Argentine research base Esperanza as the highest temperature recorded for the Antarctic continent.
Highest Temperature on the Plateau: −7.0°C, D-80 AWS, 28 December 1989
For the Antarctic Plateau, the committee evaluated the evidence for an observation of −7.0°C (19.4°F) made on 28 December 1989 at D-80 AWS, located in the interior of the Adélie Coast (70°6′S, 134°53′E; see Figure 1). The AWS operated from 14 January 1983 to 1 January 2001 at an elevation of 2500 meters [Wendler et al., 1993]. The temperature was recorded with a Weed platinum resistance thermometer sensor with an accuracy of ±0.5°C. Figure 2c shows a photograph of the station upon installation in 1983.
On 28 December 1989 ERA reanalysis showed that a high-pressure ridge situated west of Tasmania around 130°E over the Southern Ocean channeled warm air southward toward D-80 (Figure 3c). This strong ridge had been persistent over the area for the previous 4 days. The committee noted that at high elevations, insolation under clear skies will warm the air, contributing to the record high temperature. However, it was noted that in some cases high insolation can cause spurious warming of the temperature sensor if the sensor is not properly ventilated, but in this situation, the committee concluded that there should have been sufficient ventilation of the sensor.
Given these considerations and after ensuring that data were collected in compliance with WMO standards, the committee recommended unanimously to accept the observation as the highest temperature recorded for the Antarctic Plateau.
Importance of Establishing Antarctic Extremes
As with all WMO evaluations of extremes (e.g., temperature, pressure, wind, etc.), the extremes presented here are the highest observed temperatures placed before the WMO for adjudication that passed WMO’s standards for such data. It is possible, indeed, likely, that greater extremes can and have occurred in the Antarctic but have gone unreported.
It is possible, indeed, likely, that greater extremes can and have occurred in the Antarctic but have gone unreported.
Temperature extremes in the Antarctic are important to evaluate and document in the face of changing regional and global climate. Only through the continual monitoring of the entire Antarctic region can we ensure that we have the best possible data for climate change analysis at both the regional and global scales.
Acknowledgments
Meteorological observations at Signy were funded by the UK Natural Environment Research Council. The meteorological observations at the D-80 AWS site are based upon work supported by the Division of Polar Programs, National Science Foundation, under grants ANT-1245663 and PLR-1543305. We thank Institut polaire français Paul-Emile Victor for their joint support of D-80 AWS. M.B. and P.J. were supported by the European Union–funded project “Uncertainties in Ensembles of Regional Reanalyses” (UERRA, FP7-SPACE-2013-1 project number 607193). M.B. was funded by the Spanish Ministry of Economy and Competitiveness (MINECO) CGL2014-52901-P grant.
References
Cape, M. R., et al. (2015), Foehn winds link climate-driven warming to ice shelf evolution in Antarctica, J. Geophys. Res. Atmos., 120, 11,037–11,057, https://doi.org/10.1002/2015JD023465.
Dee, D. P., et al. (2011), The ERA-Interim reanalysis: Configuration and performance of the data assimilation system, Q. J. R. Meteorol. Soc., 137, 553–597, https://doi.org/10.1002/qj.828.
Elvidge, A. D., and I. A. Renfrew (2016), The causes of foehn warming in the lee of mountains, Bull. Am. Meteorol. Soc., 97(3), 455–466, https://doi.org/10.1175/BAMS-D-14-00194.1.
Liu, H., et al. (2001), Radarsat Antarctic Mapping Project digital elevation model, version 2, https://nsidc.org/data/docs/daac/nsidc0082_ramp_dem.gd.html, NASA Natl. Snow and Ice Data Cent. Distrib. Act. Arch. Cent., Boulder, Colo. [Accessed 29 August 2016.]
Speirs, J. C., et al. (2010), Foehn winds in the McMurdo Dry Valleys, Antarctica: The origin of extreme warming events, J. Clim., 23, 3577–3598, https://doi.org/10.1175/2010JCLI3382.1.
Wendler, G., et al. (1993), Katabatic winds in Adélie Coast, in Antarctic Meteorology and Climatology: Studies Based on Automatic Weather Stations, Antarct. Res. Ser., vol. 61, edited by D. H. Bromwich and C. R. Stearns, pp. 23–46, AGU, Washington, D. C., https://doi.org/10.1029/AR061p0023.
Author Information
Maria de Los Milagros Skansi, Departamento Climatología Servicio Meteorológico Nacional, Buenos Aires, Argentina; John King, Atmosphere, Ice and Climate team, British Antarctic Survey, Cambridge, UK; Matthew A. Lazzara, Madison Area Technical College, Wisc.; and University of Wisconsin–Madison; Randall S. Cerveny (email: [email protected]), School of Geographical Sciences, Arizona State University, Tempe; Jose Luis Stella, Departamento Climatología Servicio Meteorológico Nacional, Buenos Aires, Argentina; Susan Solomon, Department of Earth, Atmospheric, and Planetary Sciences, Massachusetts Institute of Technology, Cambridge; Phil Jones, Climatic Research Unit, School of Environmental Sciences, University of East Anglia, Norwich, UK; and Center of Excellence for Climate Change Research and Department of Meteorology, King Abdulaziz University, Jeddah, Saudi Arabia; David Bromwich, Byrd Polar and Climate Research Center, Ohio State University, Columbus; James Renwick, Victoria University of Wellington, New Zealand; Christopher C. Burt, The Weather Company, IBM, Atlanta, Ga.; Thomas C. Peterson, Commission for Climatology, World Meteorological Organization, Geneva, Switzerland; Manola Brunet, Centre for Climate Change, University Rovira i Virgili, Tarragona, Spain; and Climatic Research Unit, School of Environmental Sciences, University of East Anglia, Norwich, UK; Fatima Driouech, Climate Studies Service, Direction de la Météorologie nationale, Casablanca, Morocco; Russell Vose, National Centers for Environmental Information, National Oceanic and Atmospheric Administration, Asheville, N.C.; and Daniel Krahenbuhl, School of Geographical Sciences, Arizona State University, Tempe
Citation:
Skansi, M. d. L. M.,King, J.,Lazzara, M. A.,Cerveny, R. S.,Stella, J. L.,Solomon, S.,Jones, P.,Bromwich, D.,Renwick, J.,Burt, C. C.,Peterson, T. C.,Brunet, M.,Driouech, F.,Vose, R., and Krahenbuhl, D. (2017), Evaluating highest-temperature extremes in the Antarctic, Eos, 98, https://doi.org/10.1029/2017EO068325. Published on 01 March 2017.
Text © 2017. The authors. CC BY-NC-ND 3.0
Except where otherwise noted, images are subject to copyright. Any reuse without express permission from the copyright owner is prohibited.