
Today scientists released a new report that details how climate change is affecting weather and climate across the United States and how future changes in climate could play out across the country.
The Climate Science Special Report (CSSR), created by a U.S. government organization that coordinates and integrates federal research on changes in the global environment and their implications for society, also lays out the current state of science relating to climate change and its physical effects.
“It is extremely likely that human influence has been the dominant cause of the observed warming since the mid-20th century.”
“It is extremely likely that human influence has been the dominant cause of the observed warming since the mid-20th century,” the report concludes. “For the warming over the last century, there is no convincing alternative explanation supported by the extent of the observational evidence.”
And the observational evidence is manifold. Thousands of studies outlined in the report document rising surface, atmospheric, and oceanic temperatures; melting glaciers; diminishing snow cover; shrinking sea ice; rising sea levels; ocean acidification; and increasing intensity and frequency of rainfall, hurricanes, heat waves, wildfires, and drought. The report meticulously outlines how these effects can be largely traced back to human activities and associated emissions of radiatively important gases and particles.

Underlying the report is a broad scientific consensus: The farther and the faster the Earth system is pushed toward further change, the greater the risk is of unanticipated effects, some of which are potentially large and irreversible.
For example, without major reductions in emissions, the increase in annual average global temperature relative to preindustrial times could reach 9°F (5°C) or more by the end of this century. Although emission rates have slowed as economic growth is becoming less carbon intensive, this slowing trend is not yet at a rate that would limit global average temperature change to 3.6°F (2°C) above preindustrial levels by century’s end.
And there’s more. Sea levels are likely to continue to rise, and many severe weather events are likely to become more intense. Brace for more record-breaking high temperatures, including multiday heat waves, and more severe precipitation when it rains or snows. Drought could plague the western United States for decades to come. Atlantic and Pacific hurricanes are expected to get even more intense.
In other words, the report shows that our current emissions trajectories will bring our planet into a very different climate state than it is today, with profound effects for the United States.
An Authoritative Voice on the United States’ Climate Future
The report is designed to serve as the foundation for efforts to assess climate-related risks and inform decision-making about responses.
The CSSR was created by the U.S. Global Change Research Program (USGCRP) as volume 1 of the Fourth National Climate Assessment (NCA4) [Wuebbles et al., 2017]. USGCRP oversaw the production of this stand-alone report of the state of science relating to climate change and its physical impacts. CSSR is designed to be an authoritative assessment of the science of climate change, with a focus on the United States, to serve as the foundation for efforts to assess climate-related risks and inform decision-making about responses.
The CSSR serves several purposes, including providing (1) an updated and detailed analysis of the findings of how climate change is affecting weather and climate across the United States, (2) an executive summary and 15 chapters that provide the basis for the discussion of climate science, and (3) foundational information and projections for climate change, including extremes, to improve “end-to-end” consistency in sectoral, regional, and resilience analyses.
The CSSR integrates and evaluates the findings on climate science and discusses the uncertainties associated with these findings. It analyzes current trends in climate change, both human induced and natural, and projects major trends to the end of this century.
The National Oceanic and Atmospheric Administration (NOAA) is the lead administrative agency for the current report. Other agencies involved include NASA and the Department of Energy; representatives from national laboratories, universities, and the private sector also helped write the report.
The report underwent several drafts and multiple reviews, including one by the public, and expert reviews by the 13 USGCRP agencies and the National Academies of Sciences, Engineering, and Medicine. What results is a comprehensive document on the state of climate science, with assessments of statistically likely scenarios of climate in the United States through the end of the century.
Advances in Science Since the Last Assessment
The CSSR represents the most comprehensive assessment of the science done for an NCA. As such, the report reflects a number of advances in climate science since the Third U.S. National Climate Assessment (NCA3) was published in 2014.
Researchers can now more closely pinpoint the human influences for individual climate and weather extreme events.
For example, since NCA3, stronger evidence has emerged for the ongoing, rapid, human-caused warming of the global atmosphere and ocean. Researchers can now more closely pinpoint the human influences for individual climate and weather extreme events.
In addition, significant advances have been made in understanding extreme weather events in the United States and how they relate to increasing global temperatures and associated climate changes. The new report also discusses the extent to which atmospheric circulation in the midlatitudes is changing or is projected to change, possibly in ways not captured by current climate models.
For the first time in the NCA process, sea level rise projections incorporate geographic variation based on factors such as local land subsidence, ocean currents, and changes in Earth’s gravitational field. In an examination of potential risks, the CSSR found that both large-scale state shifts in the climate system (sometimes called “tipping points”) and compound extremes have the potential to generate unanticipated climate surprises.
Report Highlights: Global Perspective
At the heart of the report are some indisputable facts. The global atmospheric carbon dioxide (CO2) concentration is now everywhere more than 400 parts per million (ppm), a level that last occurred about 3 million years ago, when both global average temperature and sea level were significantly higher than today. Continued growth in human-made emissions of CO2 over this century and beyond would lead to an atmospheric concentration not experienced in tens to hundreds of millions of years.
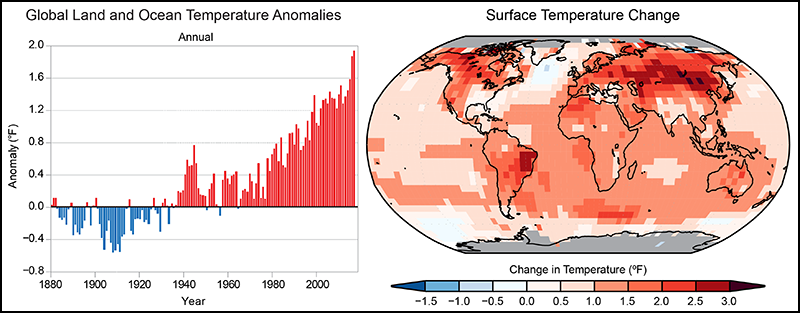
What’s more, the past 115 years are now the warmest such time span in at least the last 1,700 years. Global annually averaged surface air temperature has increased by about 1.8°F (1.0°C) since 1901 (Figure 1).
Many other aspects of global climate are changing. For example, global average sea level has risen by about 7–8 inches since 1900, with almost half (about 3 inches) of that rise occurring since 1993. Human-caused climate change has made a substantial contribution to this rise, contributing to a rate of rise that is greater than during any preceding century in at least 2,800 years.
Global average sea levels are expected to continue to rise, by at least several inches in the next 15 years and by 1–4 feet by 2100. A rise of as much as 8 feet by 2100 cannot be ruled out.
What Does This Mean for the United States?
Annual average temperature over the contiguous United States has increased by 1.8°F (1.0°C) over the period from 1901 to 2016; over the next few decades (2021–2050), annual average temperatures are expected to rise by about 2.5°F for the United States, relative to the recent past (average from 1976–2005), under all plausible future climate scenarios.
The report documents how, across the board, the higher temperatures projected for the United States and the world are expected to increase the intensity and frequency of extreme events. Changes in the characteristics of extreme events are particularly important for human safety, infrastructure, agriculture, water quality and quantity, and natural ecosystems.
Below are peeks into some of the realms in which the United States is expected to face profound change. What’s striking here is that events that we consider to be extreme may become the new normal by century’s end.
Coastal Flooding. Global sea level rise has already affected the United States; the incidence of daily tidal flooding is accelerating in more than 25 Atlantic and Gulf Coast cities. Sea level rise is expected to be higher than the global average in some parts of the United States, especially on the East and Gulf coasts of the United States. This is due, in part, to changes in Earth’s gravitational field from melting land ice, changes in ocean circulation, and local subsidence.
Larger Precipitation Events. Heavy precipitation, as either rainfall or snowfall, is increasing in intensity and frequency across the United States (Figure 2) and the globe. These trends are expected to continue. The largest observed changes in extreme precipitation in the United States have occurred in the Northeast and the Midwest.

Heat Waves. Heat waves have become more frequent in the United States since the 1960s, whereas extreme cold temperatures and cold waves have become less frequent. Recent record-setting warm years are projected to become common in the near future for the United States as annual average temperatures continue to rise.
Forest Fires. The incidence of large forest fires in the western contiguous United States and Alaska has increased since the early 1980s and is projected to further increase in those regions as the climate warms, with profound changes to regional ecosystems. The frequency of large wildfires is influenced by a complex combination of natural and human factors.
Drought. Annual trends toward earlier spring snowmelt and reduced snowpack are already affecting water resources in the western United States, with adverse effects for fisheries and electricity generation. These trends are expected to continue. Under the highest emissions scenarios and assuming no change in current water resources management, chronic, long-duration hydrological drought is increasingly possible before the end of this century.
Recent droughts and associated heat waves have reached record intensity in some U.S. regions. At this time, the report notes that evaluating the human effect on recent major U.S. droughts is complicated. Little evidence is found for a human influence on observed precipitation deficits, but much evidence is found for a human influence on surface soil moisture deficits due to increased evapotranspiration caused by higher temperatures.
Hurricanes. Physical processes suggest, and numerical modeling simulations generally confirm, an increase in tropical cyclone intensity in a warmer world, and Earth system models generally show an increase in the number of very intense tropical cyclones. For Atlantic and eastern North Pacific hurricanes, increases are projected in precipitation rates and intensity. The frequency of the most intense of these storms is projected to increase in the Atlantic and western North Pacific and in the eastern North Pacific.
Atmospheric Rivers. These narrow streams of moisture account for 30%–40% of the typical snowpack and annual precipitation on the U.S. West Coast. They are also associated with severe flooding events when they shed their moisture. The frequency and severity of landfalling atmospheric rivers will increase because rising temperatures increase evaporation, resulting in higher atmospheric water vapor concentrations.
A Fate Dependent on Emissions
The magnitude of climate change beyond the next few decades will depend primarily on the amount of greenhouse gases (especially carbon dioxide) emitted globally. And without significant cuts to emissions, annual average global temperatures will almost certainly rise beyond 2°C by the end of the century.
Choices made today will determine the magnitude of climate change risks beyond the next few decades.
In other words, the oft-stated goal of keeping globally averaged temperature change at or below this level to minimize potential impacts on humans and ecosystems can be met only through substantial reductions in emissions before 2040: Choices made today will determine the magnitude of climate change risks beyond the next few decades.
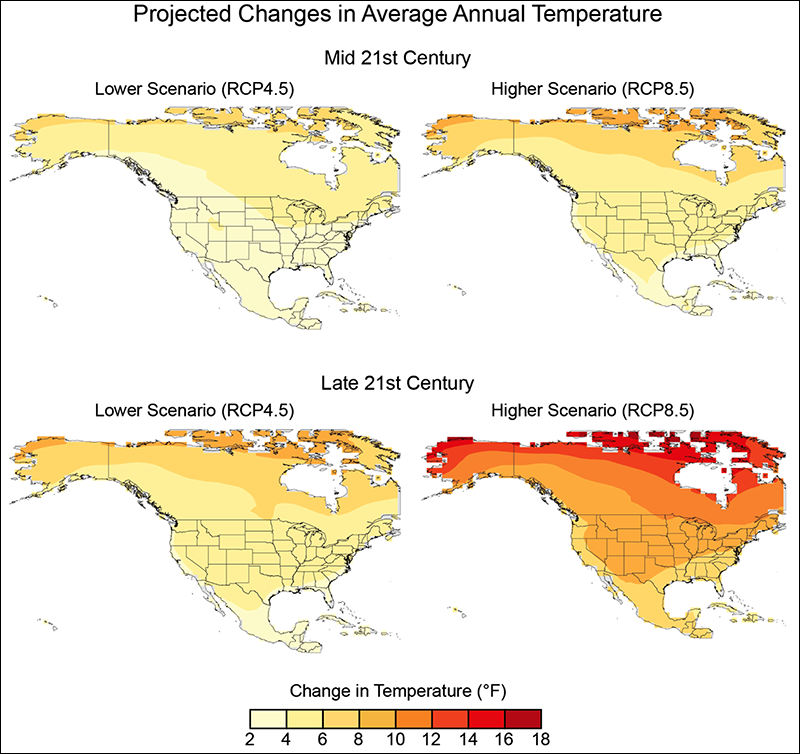
With significant reductions in emissions, the increase in annual average global temperature could be limited to 3.6°F (2°C) or less. Figure 3 shows the projected changes in U.S. temperature for two possible future pathways.
The science is in, and the CSSR documents it in a way that’s both comprehensive and revelatory. It also provides important input to the development of other parts of NCA4, which will focus primarily on the human welfare, societal, economic, and environmental elements of climate change. Volume 2 of NCA4, with an emphasis on the impacts of climate change, is planned for publication in late 2018.
Acknowledgments
Writing the CSSR required the concerted effort of a large, diverse, and experienced author team of climate scientists from across the United States working for many months. The USGCRP provided organization and guidance for the overall process, NOAA provided oversight as the lead agency, and NOAA National Centers for Environmental Information provided technical, editorial, and production support for the document drafts and final product. We appreciate the independent reviews from the public and that conducted by the National Academy of Sciences.
References
Wuebbles, D. J., et al. (Eds.) (2017), Climate Science Special Report: Fourth National Climate Assessment, vol. 1, U.S. Global Change Res. Program, Washington, D. C.
Author Information
Donald Wuebbles (email: [email protected]), Department of Atmospheric Sciences, University of Illinois at Urbana-Champaign, Urbana; David W. Fahey, Earth System Research Laboratory, National Oceanic and Atmospheric Administration, Boulder, Colo.; and Kathy A. Hibbard, Earth Science Division, NASA Headquarters, Washington, D. C.
Editor’s note: The authors of this Eos feature are the lead authors of the Climate Science Special Report. Donald Wuebbles was employed at the Office of Science and Technology Policy in Washington, D. C., and the National Science Foundation in Arlington, Va., while the report was being prepared.
Citation:
Wuebbles, D.,Fahey, D. W., and Hibbard, K. A. (2017), How will climate change affect the United States in decades to come?, Eos, 98, https://doi.org/10.1029/2017EO086015. Published on 03 November 2017.
Text © 2017. The authors. CC BY-NC-ND 3.0
Except where otherwise noted, images are subject to copyright. Any reuse without express permission from the copyright owner is prohibited.