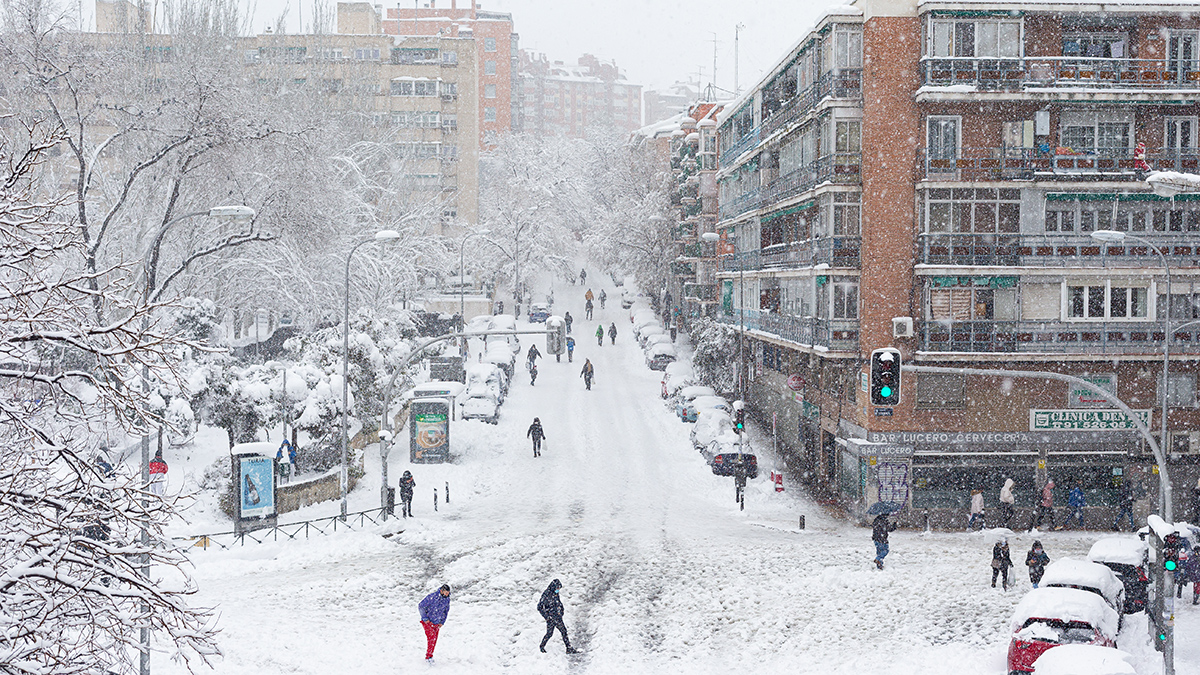
Society experiences climate change most viscerally through high-impact events such as storms, floods, and droughts. The effects of these events felt by communities vary in their geography, timing, and severity and do not necessarily correspond to statistical descriptions of the extremity of hazards dominantly used by institutional scientists. For example, a landfalling category 3 hurricane may not be statistically rare for the United States—or, on the whole, “extreme”—but it can still upend lives and livelihoods where its impacts are felt most.
Opportunities exist to contextualize extremes with respect to time, place, and severity and to connect global change science with societal experiences.
The statistical significance of environmental hazards is often what is relayed through conventional metrics and risk communication. But if the metrics and communications don’t reflect or resonate with people’s lived experiences and interests, they’re less likely to be useful in helping inform and safeguard communities.
We propose that methods of analyzing, translating, and communicating Earth system science and the associated risks of high-impact events other than those conventionally applied in research can provide more relevant information to communities navigating climate-related environmental hazards.
Opportunities exist to contextualize extremes with respect to time, place, and severity and to connect global change science with societal experiences. Scientists who understand and take these opportunities are also more likely to make connections that translate data and raw science into locally tangible and actionable information.
Statistically Significant Versus High Impact
Scientists often use statistical tools, such as the t test, to assess whether changes in a variable or a set of conditions are statistically significant—for instance, in the attribution of a specific extreme to climate change. Although this approach works well for analyzing high-frequency data (daily mean temperature measurements, say), it is less applicable for characterizing rare events.
t tests assume normally distributed data and quantify what is rare or extreme in relation to that distribution. Yet climatic extremes themselves, by their nature, do not conform to normal distributions, and their statistical significance is not well represented when measured in this way. Indeed, changes in some extreme environmental hazards, such as in the frequency and intensity of tornadoes, are hard to model statistically. Although high-impact events that are rare historically may be happening more often, longer records than are typically available are necessary to demonstrate that changes in these events are truly statistically significant.
We recommend moving away from standard statistical practices for communicating about hazards.
We have often observed anecdotally that changes in quantities irrelevant to impact (e.g., a 1-millimeter increase in flood depth) are often found to be statistically significant, whereas changes in high-impact quantities (e.g., a small increase in hurricane wind speed that leads to dramatically different outcomes for residential properties) are deemed not statistically significant. This inconsistency is hardly surprising considering the paucity of extreme event records and may lead to miscommunication between those generating and those using information about the significance (statistical or not) of an extreme.
The question, then, is whether—and in which situations—it is useful or meaningful to discuss the statistical significance of changing extreme environmental hazards in risk communication. We find that “statistically significant” and “high impact” tend to be conflated and presented interchangeably in environmental hazard risk communication, even though they have different meanings and potentially very different repercussions for those facing the hazards. For instance, a statistically significant rise in local sea levels may only become high impact when it starts to interact with the built environment.
We, and other scientists, thus recommend moving away from standard statistical practices for communicating about hazards in favor of using probabilistic analyses founded on physical reasoning, which consider the likelihood (and likely consequences) of hazard occurrences [e.g., Shepherd, 2021].
Accounting for Lived Experiences
Reducing an event to whether it is statistically rare also removes considerations of human impacts and lived experiences and potentially keeps impactful (but not statistically significant) environmental hazards from being included in scientific analyses. Further, characterizing the significance of an event in isolation, apart from the interconnected ecosystem in which it occurs, can disconnect its measured significance from on-the-ground realities. Such realities can include intersecting and compounding impacts from the immediate effects of an event, as well as, for example, ongoing environmental injustices or legacies of extractive industrial activities. These impacts may inflict shocks and stresses on communities and ecosystems that are completely obscured by conventional scientific analyses.
Typically, scientifically determined indicators and metrics, such as those focused on projected averages, do not account for the variability and subtle, yet critical, site-specific nuances of local community contexts within which environmental hazards and climate effects occur. In many Indigenous communities, for example, locally informed and relevant metrics, such as the percentage of food sourced locally and the health and quality of the food for subsistence livelihoods and food sovereignty, are often based on multigenerational and Traditional Knowledges connected to and in relationship with place. Similarly, place-based climate impact data are often seen as more useful, relevant, and grounded in people’s lived experiences than climate data themselves.
Convergence and Cocreation
Here we provide examples of where community-focused metrics and risk communications can be valuable, highlighting convergence science and cocreated research on hazards and financial risk management.
Convergence science transcends disciplinary boundaries and weaves together knowledge systems, tools, and ways of thinking and understanding to tackle key societal and scientific challenges. It can be understood as “an expression of radically affirming the deep relationality of life of the planet, of Mother Earth, of the affirmation that we are all related” [Rising Voices, Changing Coasts Hub, 2024]. This collaborative framework, involving codesign and cocreation with community partners, enhances development of meaningful climate data and metrics [Lazrus et al., 2025]. It also looks beyond prevailing climate science metrics such as temperature to better understand how climate impacts are actually felt in place by different groups.
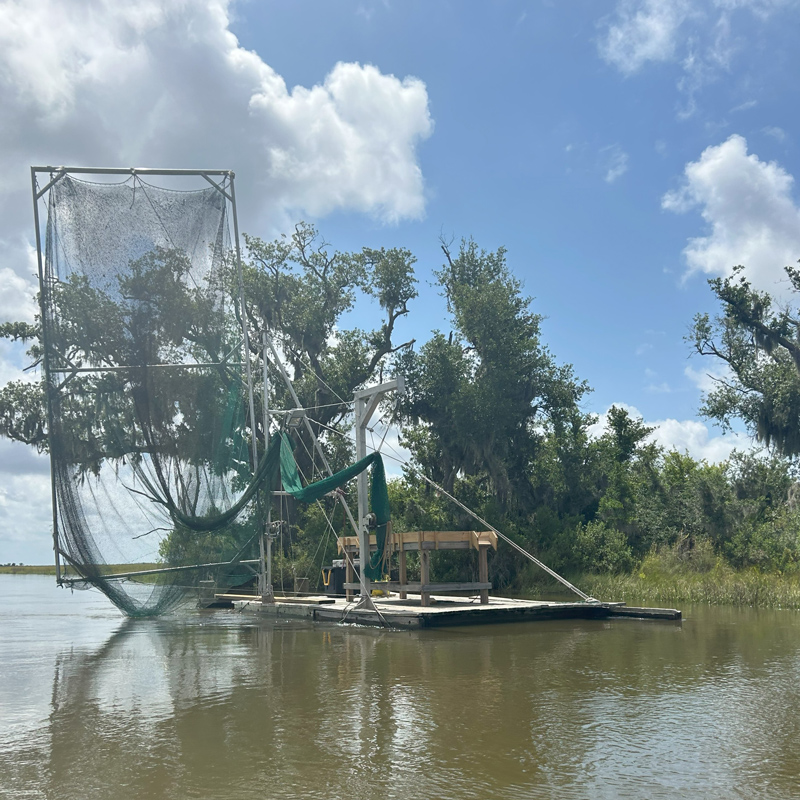
For example, traditional harvesters on the working coast of Louisiana give attention to the health and quality of the seafood harvest and to what extent traditional diets and livelihoods can be sustained [Maldonado, 2019]. Measuring environmental impacts on this place-based community’s ability to maintain traditional livelihoods and lifeways [Barger et al., 2025; The Rising Voices Center for Indigenous and Earth Sciences, 2020] requires using definitions, metrics, and baselines defined by the community.
Another example comes from the Bering Sea–Bering Strait–Chukchi Sea region. In recent decades, dramatically and rapidly changing conditions of sea ice (location, extent, thickness, ice free days, seasonal shifts), ocean temperatures, permafrost thaw, and weather have profoundly affected communities in this part of the Arctic. Changes in sea ice have affected the safety of hunting practices, limited access to prey such as Pacific walrus, and threatened traditional methods of processing and storing harvested food in many communities that have relied for millennia on marine resources for food, culture, and community health and well-being [e.g., Apassingok et al., 2024]. Sea ice reductions have also increased communities’ vulnerability to the impacts of wind, waves, and coastal erosion [e.g., Overeem et al., 2011].
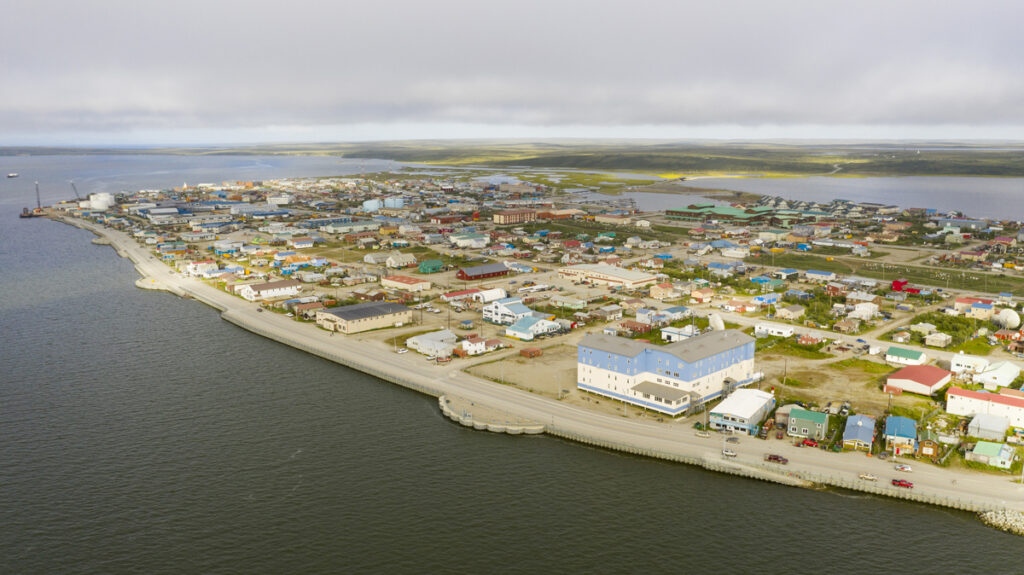
Major food shortages can result from compounding conditions that may not be extreme by themselves, such as the seasonal location of ever-shrinking sea ice and changing oceanic currents and temperatures, as well as issues of federal and state governance. Seasonal weather conditions and individual weather events—such as the October 2024 storm that caused severe flooding and damage to infrastructure in several coastal Alaskan towns—have also played roles in the extreme impacts experienced in the Bering-Chukchi region, even when these events themselves were not considered statistically extreme in isolation.
Conventional metrics and communications focused on statistically significant extremity can fail to capture how changing conditions are truly affecting the region’s peoples.
Whereas conventional metrics and communications focused on statistically significant extremity can fail to capture how changing conditions are truly affecting the region’s peoples, community-informed indicators focused more on food availability or traditional practices, for example, can be far more beneficial for guiding local decisionmaking.
A third example considers hazard metrics useful for financial risk management. Academic research into high-impact weather events in a changing climate typically compares hazard characteristics—of severe thunderstorms or tropical cyclones, say—between current and future climate periods and assesses the change in characteristics between the two periods. The timing of these future periods, however, can be somewhat arbitrary (e.g., at the end of this century).
Such assessments do not consider values or objectives of risk management, such as remaining financially solvent throughout the period leading up to the analyzed future period. They also provide information about conditions during only a narrow time window far in the future, whereas a financially destabilizing event that occurs sooner may render assessments of the more distant future obsolete.
A more usable metric would consider unacceptable risks to a given management objective, such as protecting lives or property, and calculate the time horizons at which these risks are likely to be crossed [Rye et al., 2021]. Such a metric would be cocreated by researchers and risk managers to link the changing character of hazards with management objectives. Framing climate change–induced risk in this way would allow it to be quantifiable and trackable by risk managers.
A similar approach has been proposed in engineering design, whereby the structural reliability of built infrastructure over a given service life (say, 100 years) is calculated from the maximum risk of a hazard occurring in each year to minimize associated failures [Rootzén and Katz, 2013].
An All-Hands-on-Deck Approach
The examples above by no means describe the full range of communities affected by environmental hazards, but they highlight the shared need for hazard information that is contextualized for time, place, and use.
Careful codesign of community-based metrics can enhance the relevance, uptake, and influence of geoscience information in societal decisionmaking.
Careful codesign of community-based metrics can enhance the relevance, uptake, and influence of geoscience information in societal decisionmaking [Jagannathan et al., 2021]. No single approach or framework for codesign exists. Rather, effective approaches are deeply specific to context and culture. They involve iterative processes of participatory, colearning knowledge exchange that require time and emotional labor—as well as effective mediation and shared learning strategies—to build and maintain relationships, mutual trust, and shared agreements [Jagannathan et al., 2021].
Such work should not be viewed apart from fundamental climate and global change science. On the contrary, it requires the weaving together of expertise and knowledge from many participants, including community members, practitioners, and institutional scientists. Through convergent and integrative approaches to environmental hazards research and risk communication, we can better understand—and communities can better respond to—changes in metrics that matter.
References
Apassingok, M., et al. (2024), How does the changing marine environment affect hunters’ access to Pacific walruses?, Arct. Antarct. Alpine Res., 56(1), 2367632, https://doi.org/10.1080/15230430.2024.2367632.
Barger, S., et al. (2025), Lessons from place: Indigenous-led rematriation for strengthening climate adaptation and resilience, J. Geogr., 124(3), 73–82, https://doi.org/10.1080/00221341.2025.2512244.
Jagannathan, K., A. D. Jones, and I. Ray (2021), The making of a metric: Co-producing decision-relevant climate science, Bull. Am. Meteorol. Soc., 102(8), E1579–E1590, https://doi.org/10.1175/BAMS-D-19-0296.1.
Lazrus, H., et al. (2025), Tapestries of knowledge: Using convergence science to weave Indigenous science and wisdom with other scientific approaches to climate challenges, Bull. Am. Meteorol. Soc., 106, E1558–E1565, https://doi.org/10.1175/BAMS-D-24-0215.1.
Maldonado, J. (2019), Seeking Justice in an Energy Sacrifice Zone: Standing on Vanishing Land in Coastal Louisiana, Routledge, London, www.routledge.com/Seeking-Justice-in-an-Energy-Sacrifice-Zone-Standing-on-Vanishing-Land-in-Coastal-Louisiana/Maldonado/p/book/9781629584010.
Overeem, I., et al. (2011), Sea ice loss enhances wave action at the Arctic coast, Geophys. Res. Lett., 38, L17503, https://doi.org/10.1029/2011GL048681.
Rising Voices, Changing Coasts Hub (2024), Co-created Knowledge and Actions: Moving from the Theory of Convergence Research to Practice, Working Group Session at 2024 National Tribal and Indigenous Climate Conference, Inst. for Tribal Environ. Prof., Anchorage, Alaska, 11 September, sites.google.com/view/nticc2024/home_1.
Rootzén, H., and R. W. Katz (2013), Design life level: Quantifying risk in a changing climate, Water Resour. Res., 49(9), 5,964–5,972, https://doi.org/10.1002/wrcr.20425.
Rye, C. J., J. A. Boyd, and A. Mitchell (2021), Normative approach to risk management for insurers, Nat. Clim. Change, 11(6), 460–463, https://doi.org/10.1038/s41558-021-01031-8.
Shepherd, T. G. (2021), Bringing physical reasoning into statistical practice in climate-change science, Clim. Change, 169(1–2), 2, https://doi.org/10.1007/s10584-021-03226-6.
The Rising Voices Center for Indigenous and Earth Sciences (2020), Rising Voices Workshop report on food systems, Rising Voices Workshop 2020, n2t.net/ark:/85065/d7s75mqf.
Author Information
Mari R. Tye ([email protected]) and Laura Landrum, National Science Foundation National Center for Atmospheric Research, Boulder, Colo.; Julie Maldonado, Livelihoods Knowledge Exchange Network, Winchester, Ky.; and Diamond Tachera and James M. Done, National Science Foundation National Center for Atmospheric Research, Boulder, Colo.