As highlighted in an Eos opinion piece last year [Alley et al., 2014], environmental impacts of the U.S. oil and gas boom are “hotly debated.” However, a lack of environmental data concerning the largely unregulated but rapidly developing shale industry hampers clarity in this debate. As a result, scientists, public officials, and the public regularly describe effects, such as those on public health, with only anecdotal evidence.

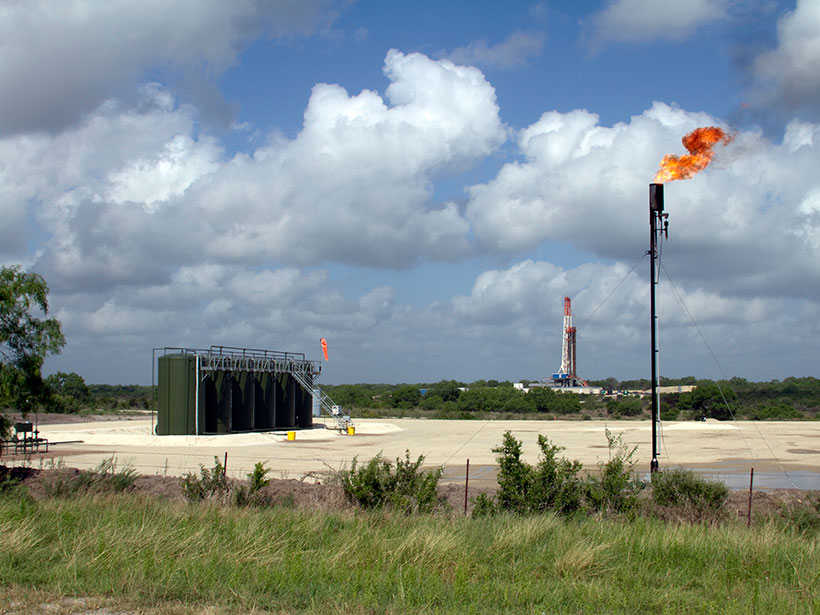
One such shale region is the Eagle Ford Shale (Figure 1). As one of the most productive shale oil and gas regions in the United States, the Eagle Ford has transformed the economies of the mostly rural communities it underlies since 2008.
However, fugitive hydrocarbon emissions from various sources during drilling, completion, and production, as well as gas flares lit to dispose of so-called associated gas—gas that comes out of solution when produced oil depressurizes—affect the air quality of the communities in the region. In particular, the rise in volatile organic compounds (VOCs)—precursors to ground-level ozone formation—worry some local governments. Over the past several decades, the United States has made significant strides in reducing summer smog produced primarily from car exhaust [Parrish et al., 2011]. Unfortunately, new observations lead us to suspect that the shale boom may be threatening that progress.
Flares in the Eagle Ford
In the Eagle Ford, annual drilling permit counts have increased dramatically since the development of the shale, with 26 permits issued in 2008 versus 4416 permits issued in 2013 [Railroad Commission of Texas, 2014]. With 17,685 wells permitted or completed as of 4 December 2014 [Railroad Commission of Texas, 2014], drilling has outpaced the growth of the pipeline network in this part of Texas, resulting in large amounts of near-permanent flaring of associated gas at oil wells, as well as temporary flaring at new gas wells.
Flaring at individual oil and gas extraction wells is rarely controlled and may therefore become a significant source of air pollutants.
Flaring replaces venting and is intended to reduce the direct emissions of methane and other associated gas. Controlled flaring, where flares act to dispose of chemicals safely, is typically more than 98% effective and operates only for limited periods of time. However, flaring at individual oil and gas extraction wells is rarely controlled and may therefore become a significant source of air pollutants, particularly soot and VOCs, adding to any fugitive emissions of hydrocarbons during drilling, well operation, and oil and gas distribution [Brandt et al., 2014].
Aerial views of the Eagle Ford at night allow for easy detection of flares. These views show that the number of flares has increased rapidly in recent years, largely because of a recent shift from shale gas to shale oil extraction for economic reasons.
Unregulated Emissions
Because until recently emissions per flare were presumed small, few scientific efforts have gone into related air quality assessments in shale exploration areas.
Because governments do not always regulate flaring effectively and because until recently emissions per flare were presumed small, according to the U.S. Environmental Protection Agency (EPA), few scientific efforts have gone into related air quality assessments in shale exploration areas [e.g., Thompson et al., 2014]. Several recent studies, however, show that EPA surveys likely underestimate methane emissions from oil and gas extraction activities [Howarth, 2014], and fewer studies have placed an emphasis on flaring or coemitted hydrocarbon emissions as sources of air pollution.
Although unburned fugitive hydrocarbon emissions are expected to contribute little, VOCs formed in flares, specifically unsaturated hydrocarbons and aldehydes such as ethene and formaldehyde, are potent precursors of local and regional ozone formation.
Incomplete Studies

Ozone mixing ratios in the San Antonio metropolitan area, typically downwind of the Eagle Ford, have increased in parallel to oil production and associated flaring (Figure 2a). Concerned by the increasing ozone mixing ratios, the Alamo Area Council of Governments (AACOG) developed an emissions inventory and scenario for the shale area and studied the potential effects on regional ozone formation [AACOG Natural Resources/Transportation Department, 2013, 2014].
The findings included VOC emissions likely exceeding metropolitan emissions in San Antonio and significant ozone formation from shale area VOC and nitrogen oxide (NOx) emissions but possibly no future ozone standard violations.
We question the latter because it is based on conservative and outdated assumptions about flaring emissions. The AACOG study worked with approximately half the NOx and VOC emissions listed in newer estimates and did not account for less efficient flares and more reactive VOC emissions, such as formaldehyde. Field-based results from Canada using VOC measurements affected by flares [Simpson et al., 2013; Strosher, 2000] strongly suggest that both reactive VOC emissions, such as ethene, and air toxics, such as benzene, are among the emissions.
Toward a Clearer Picture of Air Quality
The Texas Commission on Environmental Quality (TCEQ) monitors VOCs at various locations throughout the state, including the Barnett Shale dry gas production area close to the Dallas/Fort Worth metroplex, where little flaring occurs. To address growing concerns in central Texas, TCEQ installed a new VOC monitor north of the Eagle Ford in summer 2013 and another recently in Karnes City, the heart of the Eagle Ford. There is thus no long-term history on local air quality as affected by oil and gas exploration in the Eagle Ford.
Nonetheless, using TCEQ data, we analyzed VOC monitor data from western San Antonio (Old Highway 90), the Gulf Coast (Corpus Christi and Clute), and the monitor near the Eagle Ford in southeast Floresville. Data at Floresville are collected once per hour using an automated gas chromatograph–flame ionization detection system. VOC data from all other sites are collected over 24 hours once every 6 days; mixing ratios are assessed using gas chromatography–mass spectrometry.
Ethane mixing ratios along the coast have remained relatively constant since 2007, but inland mixing ratios have been steadily increasing since 2009.
We restricted our analysis to air mass origins in the Gulf of Mexico and focused on the development of ethane as a marker of oil and gas exploration. As shown in Figure 2b, ethane mixing ratios along the coast have remained relatively constant since 2007, but inland mixing ratios have been steadily increasing since 2009.
During the early years of Eagle Ford Shale development (2008 to 2011), ethane mixing ratios in San Antonio were less than 2 parts per billion (ppb) higher than those in Corpus Christi. However, in 2012 and 2013, the enhancement of ethane between Corpus Christi and San Antonio increased to 4–5 ppb on average, a highly statistically significant (p < 0.0002) increase.
When the new Floresville monitor data are analyzed as a function of wind direction (example in Figure 2c), two directions stand out: southwest to west and east to southeast, directions for which the approaching air masses spend more time in the shale area and pass over large flaring sources. Ethane mixing ratios from both of these directions are statistically significantly greater than mixing ratios from the southeast to southwest direction (p < 0.0001).
Shale Oil and Gas: A Major Source of Air Pollution
Although we continue to analyze the data, these snapshots clearly show that the boom of unconventional oil and gas exploration is developing into a major source of air pollution in this area. Air quality modeling should provide further confirmation of these preliminary findings.
Nonetheless, we suggest that these rapid changes to air quality have begun to counter the EPA-documented progress made in reducing ozone pollution in the past several decades.
References
Alamo Area Council of Governments (AACOG) Natural Resources/Transportation Department (2013), Development of the extended June 2006 photochemical modeling episode, report, 260 pp., Alamo Area Counc. of Gov., San Antonio, Tex.
Alamo Area Council of Governments (AACOG) Natural Resources/Transportation Department (2014), Oil and gas emission inventory, Eagle Ford Shale, report, 260 pp., Alamo Area Counc. of Gov., San Antonio, Tex.
Alley, W. M., J. A. Cherry, B. L. Parker, and M. C. Ryan (2014), Nuclear waste disposal: A cautionary tale for shale gas development, Eos Trans. AGU, 95(29), 264, doi:10.1002/2014eo290005.
Brandt, A. R., et al. (2014), Methane leaks from North American natural gas systems, Science, 343(6172), 733–735, doi:10.1126/science.1247045.
Howarth, R. W. (2014), A bridge to nowhere: Methane emissions and the greenhouse gas footprint of natural gas, Energy Sci. Eng., 2(2), 47–60, doi:10.1002/ese3.35.
Parrish, D. D., H. B. Singh, L. Molina, and S. Madronich (2011), Air quality progress in North American megacities: A review, Atmos. Environ., 45(39), 7015–7025, doi:10.1016/j.atmosenv.2011.09.039.
Railroad Commission of Texas (2014), Eagle Ford Shale information, report, Austin, Tex. [Available at https://www.rrc.state.tx.us/oil-gas/major-oil-gas-formations/eagle-ford-shale/.]
Simpson, I. J., J. E. Marrero, S. Batterman, S. Meinardi, B. Barletta, and D. R. Blake (2013), Air quality in the industrial heartland of Alberta, Canada and potential impacts on human health, Atmos. Environ., 81, 702–709, doi:10.1016/j.atmosenv.2013.09.017.
Strosher, M. T. (2000), Characterization of emissions from diffusion flare systems, J. Air Waste Manage. Assoc., 50(10), 1723–1733, doi:10.1080/10473289.2000.10464218.
Thompson, C. R., J. Hueber, and D. Helmig (2014), Influence of oil and gas emissions on ambient atmospheric non-methane hydrocarbons in residential areas of northeastern Colorado, Elementa, 2(1), 000035, doi:10.12952/journal.elemanta.000035.
—Gunnar W. Schade and Geoffrey S. Roest, Department of Atmospheric Sciences, Texas A&M University, College Station; email: [email protected]
Citation: Schade, G. W., and G. S. Roest (2015), Is the shale boom reversing progress in curbing ozone pollution?, Eos, 96, doi:10.1029/2015EO028279. Published on 21 April 2015.
Text © 2015. The authors. CC BY-NC 3.0
Except where otherwise noted, images are subject to copyright. Any reuse without express permission from the copyright owner is prohibited.