
The geology of the Gulf of Mexico (GOM) is dynamic, driven not by plate tectonics but by the movement of subsurface bodies of salt. Salt deposits, a remnant of an ocean that existed some 200 million years ago, behave in a certain way when overlain by heavy sediments. They compact, deform, squeeze into cracks, and balloon into overlying material.
Salt tectonics sculpt the geologic strata and seafloor in the Gulf of Mexico like few other places on Earth.
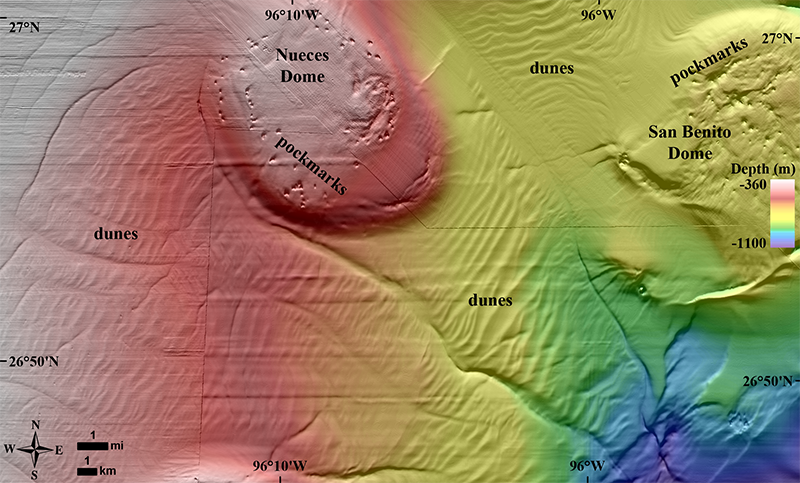
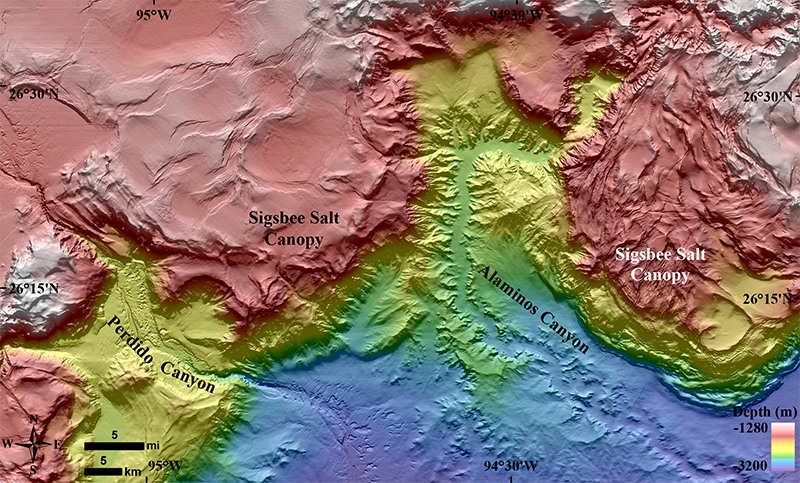
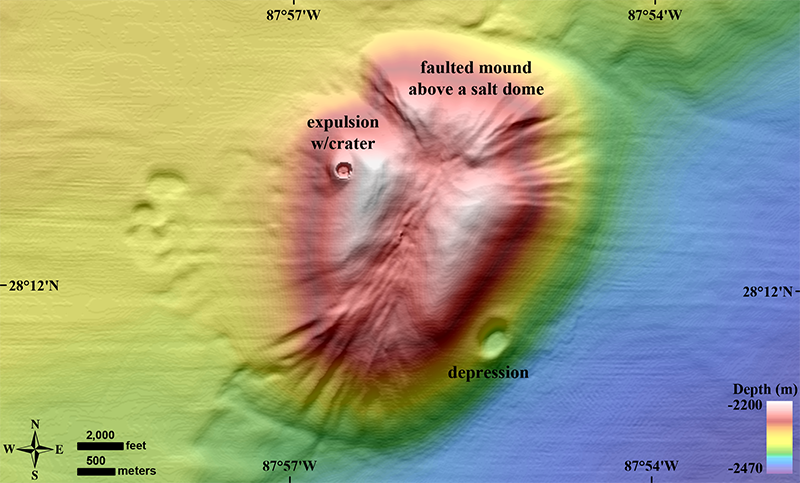
Such salt tectonics continue to sculpt the geologic strata and seafloor in the GOM like few other places on Earth. Because of this salt tectonism and a steady supply of sediment delivered to the basin by rivers, the GOM’s seafloor is a terrain continually in flux. Bathymetry is ripe with active faults and escarpments, slump blocks and slides, canyons and channels, sediment waves, pockmarks and mud volcanoes, and other natural oil and gas seeps.
Now a new regional seafloor data set created by the U.S. Department of the Interior’s Bureau of Ocean Energy Management (BOEM) reveals that dynamic environment with stunning new clarity. The data include detailed seismic surveys originally shot by 15 different companies involved in the oil and gas industry. BOEM gained permission to release the relevant proprietary data publicly in a freely downloadable aggregate map of the seafloor.

With a resolution as fine as 149 square meters per pixel, about equal to the areal footprint of an American single-family house, BOEM’s bathymetry map is at least 16 times higher in resolution than the map historically used for the northern GOM. Most of those house-sized pixels in the new map are 1, 2, and 3 kilometers deep under the water, and the product contains 1.4 billion of them, making this a gigapixel map.
How Did the Salt Get There?
It is hypothesized that the salt precipitated out of hypersaline seawater when Africa and South America pulled away from North America during the Triassic and Jurassic, some 200 million years ago. The GOM was initially an enclosed, restricted basin into which seawater infiltrated and then evaporated in an arid climate, causing the hypersalinity (similar to what happened in the Great Salt Lake in Utah and the Dead Sea between Israel and Jordan).
Salt, buried kilometers deep, deformed like putty over time, oozing upward toward the seafloor.
Salt filled the basin to depths of thousands of meters until it was opened to the ancestral Atlantic Ocean and consequently regained open marine circulation and normal salinities. As geologic time progressed, river deltas and marine microfossils deposited thousands more meters of sediments into the basin, atop the thick layer of salt.
The salt, subjected to the immense pressure and heat of being buried kilometers deep, deformed like putty over time, oozing upward toward the seafloor. The moving salt fractured and faulted the overlying brittle sediments, in turn creating natural pathways for deep oil and gas to seep upward through the cracks and form reservoirs within shallower geologic layers [Buffler and Sawyer, 1985; Hudec et al., 2013].
Out with the Old? Not So Fast
The most popular bathymetry map of the northern Gulf of Mexico has been the version generated in the 1990s by the National Oceanic and Atmospheric Administration (NOAA), the National Geophysical Data Center (NGDC), and Texas A&M’s Gulf of Mexico Coastal Ocean Observing System (GCOOS). The organizations compiled it using data from various multibeam sonar surveys and 2-D seismic lines spaced kilometers apart, providing a resolution of up to 2500 square meters per pixel. This is excellent resolution, geophysically speaking, and for the past 2 decades the map has been a respected and popular regional data set within science, academia, and the oil and gas industry.
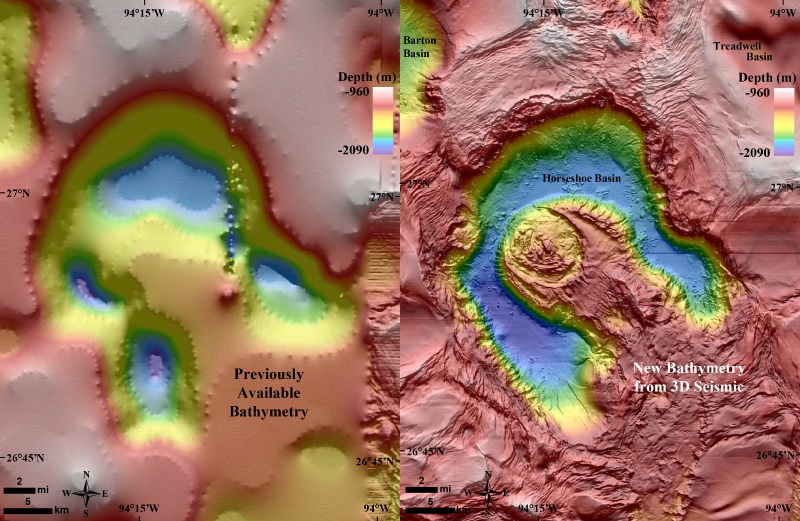
BOEM’s new map, derived exclusively from 3-D seismic data, doesn’t cover as large an area as the NOAA/NGDC/GCOOS map, but its enhanced resolution and consistent pixel size reveal undiscovered and previously poorly resolved geologic features over the continental slope, salt minibasin province, abyssal plain, Mississippi Fan, and the Florida Shelf and Escarpment. However, because of the new map’s smaller coverage, the historic map will continue to be very useful.

BOEM’s Seismic Database
BOEM researchers constructed the map using BOEM’s confidential database of 3-D seismic surveys, each survey having been originally shot by the oil and gas industry in their search for hydrocarbons. As the bureau responsible for issuing geophysical survey permits in offshore federal waters, the U.S. Code of Federal Regulations reserves the right of BOEM to request a copy of each survey after it has been processed and cleaned up to meet specific quality standards.
Our 3-D seismic database of confidential data covers 350,000 square kilometers of the Gulf of Mexico.
After receiving a survey from a geophysical contractor or oil company, BOEM scientists use the data to assist with other important regulatory duties, such as assessing the geology for potential and discovered reservoirs of oil and gas. As of 2017, this 3-D seismic database of confidential data covers 350,000 square kilometers of the Gulf of Mexico, an area larger than the state of New Mexico. The oldest surveys in this database date back to the 1980s.
Deepwater Horizon and the First Integrated Map
In an ongoing effort since 1998, BOEM has used that database to map the seafloor across hundreds of surveys with the goal of identifying potential hard-ground substrates at naturally occurring oil and gas seeps suitable for benthic communities of corals and chemosynthetic organisms (e.g., mussels, clams, and tubeworms). These organisms consume the hydrocarbons and hydrogen sulfide released from those seeps.
Biologists, aware of our database, requested a semiregional map to model the area affected by the oil plume.
When the tragic Deepwater Horizon oil spill occurred in 2010, marine biologists of NOAA’s Natural Resource Damage Assessment division needed a detailed map of the seafloor surrounding the incident to model how many of those benthic communities may have been affected. NOAA biologists, aware of BOEM’s expansive seafloor database, requested that its geoscientists create a semiregional map that NOAA could use to model the area affected by the oil plume.
The effort required the researchers to devise a method for combining their multiple overlapping seafloor maps of the spill region, made using different 3-D seismic surveys, into a single gridded surface. Through that, the idea for an even broader gigapixel map was born.
Creating a Gigapixel Grid
Geoscientists realized the potential they had available to them: They could combine the rest of their seafloor maps to cover most of the northern Gulf of Mexico under deep water.
Having developed the method and delivered the map to the biologists, the geoscientists realized the potential they had available to them: They could combine the rest of their seafloor maps to cover most of the northern GOM under deep water.
BOEM geoscientists used 3-D time-migrated surveys (in which depth is presented in milliseconds traveled by induced or passive seismics, not in feet or meters) to create the original grid. The researchers then assigned cells in the grid to depths using an algorithm developed by Advocate and Hood [1993]. They then compared the resulting depth grid with more than 300 well penetrations across the GOM to determine the time-depth conversion error, which averaged 1.3% of water depth.
The highest average error, 5%, occurs in water depths shallower than 150 meters because of the nature of conventional seismic acquisition in shallow water and the high variability of temperature and salinity in shallow water, which affect the velocity of sound in water. BOEM scientists decided that the seismic data acquired on the GOM’s shallow shelf often contain too much noise for the seafloor interpreter to accurately determine where the water ends and the sediment begins. This meant that BOEM’s map could not include certain areas of the shelf, making it smaller than the historic NOAA map, which does cover the shelf.
Within the depth range of 500 to 3300 meters (where the largest part of the grid exists), average error was calculated to be less than 0.5% of water depth. This low error meant that data from these depths would reveal the finest-resolution regional deepwater bathymetry ever created.

Making an Aggregate Map
The geoscientists began with more than 200 individual seafloor maps created from 3-D surveys dating from the late 1980s to the 2010s. In the U.S. portion of the Gulf of Mexico, few areas are covered by only a single survey (some are covered by four or more), and the interpreters needed to compare one with another to determine which was made using the best data. They created a mosaic of more than 100 of their highest-quality bathymetry maps, spanning water depths of 40 to 3379 meters and interpreted on seismic surveys originally shot by 15 different geophysical companies.
Geoscientists created a mosaic of more than 100 of their highest-quality bathymetry maps, interpreted on seismic surveys originally shot by 15 different geophysical companies.
Even though BOEM maintains copies of all the seismic data, the original companies retain legal ownership for a period of 25 years. Mergers and acquisitions through the years meant that instead of being required to ask 15 companies for permission to publish, BOEM needed to request it from only 7: CGG Services (U.S.), Inc.; ExxonMobil Corporation; Petroleum Geo-Services (PGS); Seitel, Inc.; Spectrum USA; TGS-NOPEC Geophysical Company; and WesternGeco, LLC.
Obtaining permission from these seven companies took months, much longer than anticipated, but eventually, BOEM received all necessary permissions and began the publication process. The new high-resolution grid is downloadable from the BOEM website. The site also offers GIS layers that classify over 34,000 seafloor features such as pockmarks, channels, hard grounds, mud volcanoes, natural seeps, and others.
Figures 5–9 showcase the detail of BOEM’s GOM gigapixel map, the payoff for 19 years of mapping efforts.


Acknowledgments
We thank CGG Services (U.S.), Inc.; ExxonMobil Corporation; PGS; Seitel, Inc.; Spectrum USA; TGS-NOPEC Geophysical Company; and WesternGeco, LLC for granting us permission to publish their data.
References
Advocate, D. M., and K. C. Hood (1993), An empirical time-depth model for calculating water depth, northwest Gulf of Mexico, Geo Mar. Lett., 13, 207–211, https://doi.org/10.1007/BF01207749.
Bouma, A. H., W. R. Bryant, and J. W. Antoine (1968), Origin and configuration of Alaminos Canyon, northwestern Gulf of Mexico, Trans. Gulf Coast Assoc. Geol. Soc., 18, 290–296.
Bryant, W., et al. (2000), Mega-furrows on the continental rise south of the Sigsbee Escarpment, northwest Gulf of Mexico, paper presented at the American Association of Petroleum Geologists Annual Convention, New Orleans, La., 16–19 April.
Bryant, W., et al. (2004), Deep-sea furrows: Physical characteristics, mechanisms of formation and associated environmental processes, RPSEA Rep. 0018-04, 4 pp., Dep. of Oceanogr. and Offshore Technol. Res. Cent., Texas A&M Univ., College Station.
Buffler, R. T., and D. S. Sawyer (1985), Distribution of crust and early history, Gulf of Mexico Basin, Trans. Gulf Coast Assoc. Geol. Soc., 35, 333–344.
Damuth, J. E., C. H. Nelson, and H. C. Olson (2006), GIB Phase 2 Project Atlas, Propr. UTIG Rep., Oil Co. Consort., Gulf of Mexico Intraslope Basins Proj.
Frazier, D. E. (1974), Depositional episodes: Their relationship to the Quaternary stratigraphic framework in the northwestern portion of the Gulf basin, Geol. Circ. 74-1, 28 pp., Bur. of Econ. Geol., Univ. of Texas at Austin.
Hovland, M., and A. G. Judd (1988), Seabed Pockmarks and Seepages: Impact on Geology, Biology and the Marine Environment, 293 pp., Graham and Trotman, London, doi:10.13140/RG.2.1.1414.1286.
Hudec, M. R., et al. (2013), Jurassic evolution of the Gulf of Mexico salt basin, AAPG Bull., 97, 1683–1710, https://doi.org/10.1306/04011312073.
Lopez, M. (2001), Architecture and depositional pattern of the Quaternary deep-sea fan of the Amazon, Mar. Pet. Geol., 18, 479–486, https://doi.org/10.1016/S0264-8172(00)00071-4.
McConnell, D. R., and B. A. Kendall (2002), Images of the base of gas hydrate stability, Northwest Walker Ridge, Gulf of Mexico, in OTC 2002: Deep into the Future, Pap. 14103, 10 pp., Soc. of Pet. Eng., Richardson, Texas, https://doi.org/10.4043/14103-MS.
Meyer, D., et al. (2005), Emergence of the lower Tertiary Wilcox trend in the deepwater Gulf of Mexico, World Oil Mag., May, 72–77.
Mobley, C. (2005), Late Quaternary Louisiana shelf-margin deltaic deposition, north-central Gulf of Mexico, M.S. thesis, Univ. New Orleans Theses Diss. 237, 107 pp., Univ. of New Orleans, New Orleans, La.
Posamentier, H. (2003), Depositional elements associated with a basin floor channel-levee system: Case study from the Gulf of Mexico, Mar. Pet. Geol., 20, 677–690, https://doi.org/10.1016/j.marpetgeo.2003.01.002.
Roberts, H. H., and R. S. Carney (1997), Evidence of episodic fluid, gas, and sediment venting on the northern Gulf of Mexico continental slope, Econ. Geol., 92(7–8), 863–879, https://doi.org/10.2113/gsecongeo.92.7-8.863.
Author Information
K. V. Kramer (email: [email protected]) and W. W. Shedd, Bureau of Ocean Energy Management, U.S. Department of the Interior, New Orleans, La.
Citation:
Kramer, K. V.,Shedd, W. W. (2017), A 1.4-billion-pixel map of the Gulf of Mexico seafloor, Eos, 98, https://doi.org/10.1029/2017EO073557. Published on 24 May 2017.
Text not subject to copyright.
Except where otherwise noted, images are subject to copyright. Any reuse without express permission from the copyright owner is prohibited.