Source: Geophysical Research Letters
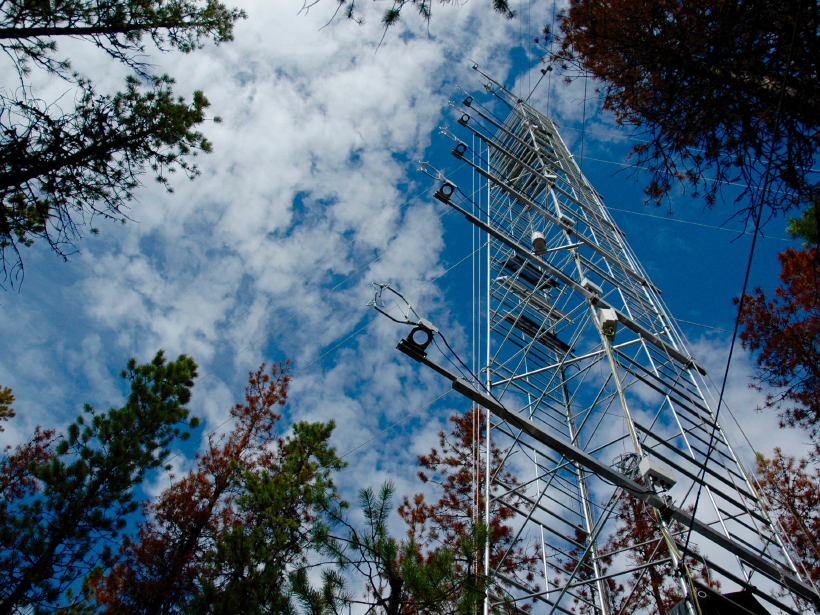
When it comes to understanding how heat, water, and carbon cycle from the landscape to the atmosphere and back, scientists rely on data from thousands of observation towers around the world. The instruments on these flux towers measure the carbon emitted in cities and absorbed by forests, along with evaporation, precipitation, sunlight, and temperature—everything that is needed to calculate Earth’s energy, water, and carbon budgets, which underpin our weather and climate models.
Now a new study suggests that data from all of these towers share a flaw in their processing that has left some energy unaccounted for, lost in the turbulent wind near the ground. Fixing this could resolve some longstanding discrepancies in these global data sets where energy and carbon seem to be missing.
Measuring how much water is evaporating or how much carbon a forest is absorbing is no easy task: At low altitudes, the wind is constantly swirling around obstacles like trees and buildings, as well as because of friction as it sweeps across the ground. Although a gentle breeze might feel steady, in reality, it’s made up of chaotic, turbulent swirls and eddies.
To account for the eddies, scientists use a statistical method called the eddy covariance method. This allows them to average out the turbulence and calculate the steady exchange of energy and gases.

However, the method relies on a key assumption: that eddies retain their structure as they are blown in the wind, regardless of size. An analogy would be the eddies left by the paddles of a rowboat in a river: The river’s flow doesn’t disrupt the eddies, which remain “frozen” in the stream. In addition, regardless of the size of the eddies, they all move at the same speed, whisked downstream. This is known as Taylor’s hypothesis, named after Sir Geoffrey Ingram Taylor, and the assumption is part of the basic processing applied to nearly all global flux observations.
Whether the hypothesis applies to the atmosphere is something that scientists have long debated, especially given how much data depend on it. Even in 1938, when Taylor first pointed out the phenomenon, he noted that it only held at low levels of turbulence, when eddies are large.
Cheng et al. set out to measure whether atmospheric turbulence follows Taylor’s hypothesis, using a highly sensitive setup of fiber-optic cables that they constructed next to a tower site on the plains outside Stillwater, Okla. The fiber optics spanned a distance of 233 meters and could sense the tiny changes in temperature as each eddy drifted by. The team also supplemented their observations with fluid dynamics models of turbulent eddies.
Their data showed that Taylor’s hypothesis breaks down with smaller eddies: Smaller eddies moved at a slower speed than larger eddies, indicating that they’re not “frozen” into a steady wind but are, instead, dissipating in the breeze. This means that this energy is not being accounted for by current data processing techniques. The team thinks that global flux data sets underestimate the amount of energy in these eddies by 10% to 30%.
This makes sense because many such data sets have long had discrepancies in their accounting of the transfer of heat and carbon between the surface and the atmosphere. To address this, the team calculated a correction factor, which they propose should be applied to all global flux data sets. This correction should close up some of these errors and improve the data sets’ accuracy. (Geophysical Research Letters, https://doi.org/10.1002/2017GL073499, 2017)
—Mark Zastrow, Freelance Writer
Citation:
Zastrow, M. (2017), Global atmospheric observations may need tweaking for turbulence, Eos, 98, https://doi.org/10.1029/2017EO075455. Published on 14 June 2017.
Text © 2017. The authors. CC BY-NC-ND 3.0
Except where otherwise noted, images are subject to copyright. Any reuse without express permission from the copyright owner is prohibited.