Source: AGU Advances
Every Thursday at 8:30 a.m. Eastern time, the U.S. Drought Monitor (USDM) publishes a map of drought conditions across the United States. Established in 2000, the USDM combines measurements of physical variables like soil moisture and runoff with reports of drought effects like fallow fields and reductions in municipal water supply. Though generated by experts and informed by data, it is in some ways a subjective interpretation of drought conditions. And it carries significant political and economic ramifications—the USDM informs state declarations of emergency, as well as drought relief payments issued by the U.S. Department of Agriculture.
The USDM classifies localities into six drought categories, ranging from “none” to “exceptional.” Each category is based on thresholds of event rarity. Some weeks, the placid white representing normal conditions blankets much of the country; other weeks, splotchy maroon pockets of exceptional drought pop off the map like blistered burns.
Li et al. assessed weekly USDM reports from 2000 to 2022 to determine whether the monitor is adequately capturing changes in the climate. This is the first effort to quantitatively link shifting drought behavior to the USDM and its drought class frequency guidelines. The authors analyzed trends across six hydroclimate variables and evaluated whether these changes were reflected in the USDM’s drought threshold percentiles.
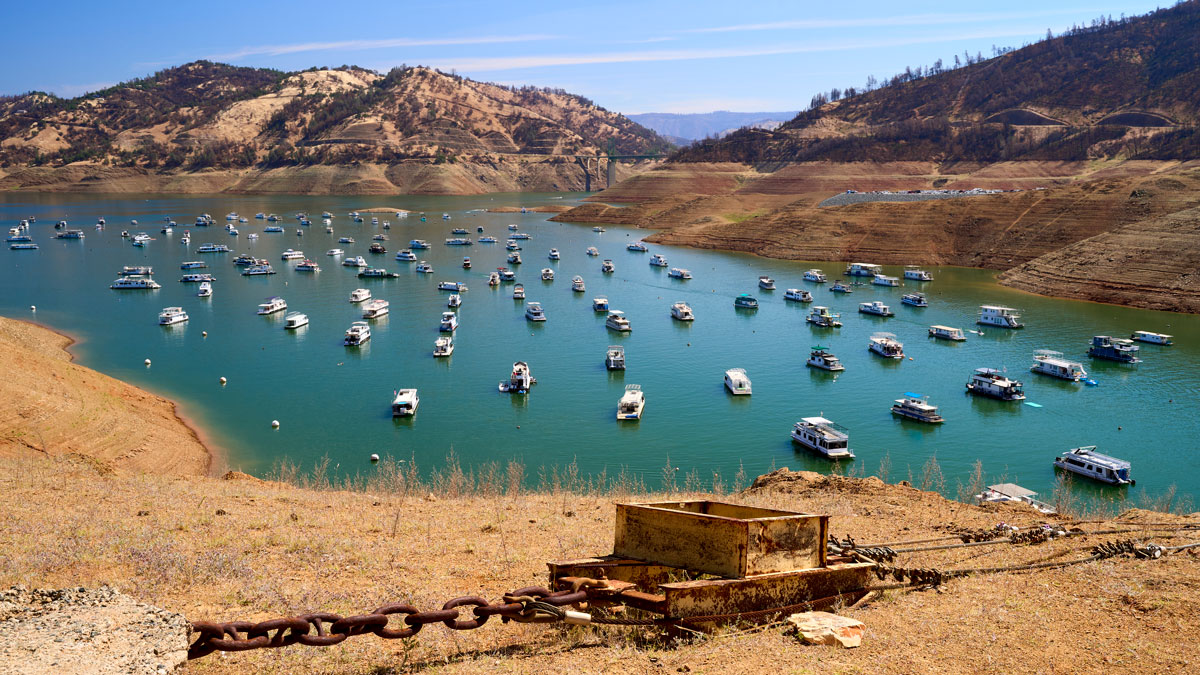
The results showed that across the country, but particularly in the American West, drought occurred more frequently than the thresholds suggest it should in a stationary climate, or one whose parameters don’t change over time. These findings mirrored trends in hydroclimate variables over the study period. Across large swaths of the West, the USDM record shows a prolonged dry period. The thresholds are designed so that exceptional drought should occur just 2% of the time. But for the first 23 years of the century, some places experienced it up to 18% of the time.
The findings confirmed that the expert opinions of the USDM are capturing climate variability and trends toward warmer and dryer conditions, particularly in the Southwest. But the authors note that the results also raise important questions about how drought classifications based on historical data will apply to future conditions in a warmer climate. Can exceptional drought be defined the same way in the past, present, and future? The interpretation of this question, and the subsequent application of drought thresholds, will increasingly challenge policymakers and could have costly ramifications for drought-stricken communities. (AGU Advances, https://doi.org/10.1029/2023AV001070, 2024)
—Aaron Sidder, Science Writer