
It is almost too obvious to state: Proficiency requires practice. As educators, if we want our students to excel at a task, we must design experiences that allow them to practice. If we want our students to learn to “do science,” then they should practice asking and answering real scientific questions, using real data.
Students and educators can tap into publicly available data sets without needing to conduct their own lengthy observation campaigns.
Our team developed Project Environmental Data-Driven Inquiry and Exploration (Project EDDIE) to provide college educators with adaptable, modular, and pedagogically sound activities that get students working with large data sets. Project EDDIE focuses on sensor-based data sets—those collected by instruments that sense environmental variables such as streamflow and soil respiration—because students and educators can tap into publicly available data sets without needing to conduct their own lengthy observation campaigns.
The Project EDDIE team includes scientists in the Earth, environmental, and biological sciences, working together with science education specialists. Together, we have created 10 groups of classroom activities, leveraging different data sources that engage students in the process of answering scientific questions with data.
Why Sensor-Based Data Sets?
Educators face significant challenges if they wish to assign data-driven exercises to students. Gathering real data requires a large investment of time and resources—for example, training students in the technical skills needed to gather unbiased data. Although these technical skills are valuable, their cost-benefit calculation may not be favorable for an educator faced with a large introductory class or a limited budget for research-grade equipment. Moreover, it can be easy for students to get bogged down in the methodological details of data collection and lose sight of the big scientific questions that drive data collection in the first place.
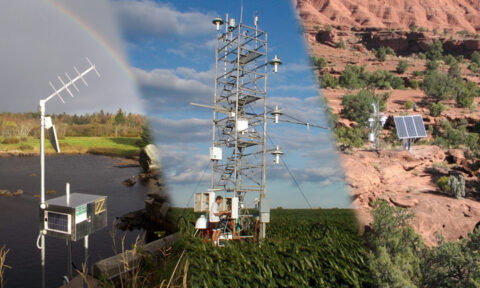
In the past few decades, the Internet has provided anyone interested with a wealth of new data from a variety of environmental sensors (Figure 1), such as the real-time streamflow data available from the U.S. Geological Survey (USGS). In fact, the availability of data may be expanding more rapidly than the preparation of a workforce able to use this technology [Benson et al., 2010]. These continuous, sensor-based records provide an unprecedented opportunity for students to ask real scientific questions and to answer those questions with real data.
Educators have begun to use these data sets in undergraduate classrooms to teach both fundamental and cutting-edge concepts in geology, ecology, and environmental sciences. Because the analysis of these data sets requires only a computer and basic software, students enrolled in online or distance-learning courses could, in theory, be able to engage with the data too.
Big Data, Big Challenges
Even though data sets may be publicly available, they can be challenging to use in the classroom. Simply learning to manipulate data can be challenging for students who may have minimal prior experience with spreadsheets or databases. Furthermore, Ledley et al. [2008] note that online data sets are typically compiled by scientists for other scientists; nonspecialists may have difficulty working with the data or even finding it.
However, simplifying the data is not necessarily a good approach for instructors because providing prepackaged, simulated data sets to students can sacrifice some of the excitement of working with real data and fails to teach the skills students need to find and process data. Moreover, the “messiness” of working with real data brings crucial statistical concepts of variability and randomness to the forefront, as it does in real scientific studies.
Useful activities promote student-centered learning coupled with scientific discourse, making student tasks closely resemble the work of scientists.
What educators need, then, is a flexible approach for getting students working with data as quickly as possible, in a way that minimizes student frustration while still exposing them to the real-world challenges of manipulating sensor-based data sets. As Langen et al. [2014] suggest, effective activities should be carefully scaffolded to introduce new challenges one at a time to keep students from becoming too frustrated.
However, activities should not be “cookbook” exercises that can be followed step by step. Instead, useful activities promote student-centered learning coupled with scientific discourse, making student tasks closely resemble the work of scientists. Of course, developing such activities requires significant investments of time and energy, which may deter educators from making the attempt.
Project EDDIE’s Strategy
Project EDDIE emerged from conversations among early-career faculty at meetings of the Global Lake Ecological Observatory Network (GLEON); the group later expanded to include additional hydrologists and biogeochemists. Participants wanted to develop effective classroom activities using authentic, large data sets that are freely available online. These activities would be grouped into independent self-contained “modules” that could be used in a classroom with minimal prior student knowledge.
During summer meetings in 2014 and 2015, team members developed 10 different modules, each containing several classroom activities (Table 1). Although each module uses different sensor-based and long-term data sets to address different research questions, all of the modules are designed with four goals for student learning outcomes:
- Students should be able to manipulate large data sets at different scales in order to conduct inquiry-based investigations.
- Students should improve their ability to reason about statistical variation.
- Students should engage in authentic and productive scientific discourse.
- Students should gain insight into the nature of scientific inquiry in the natural sciences.
| Table 1. Current Project EDDIE Modules and Some of the Data Sets | ||
| Module | Data Set(s)a | Status |
| Lake Ice-off Phenology | NSIDC Global Lake and River Ice Phenology Database | Complete |
| Lake Metabolism | Respiration calculated from GLEON lake data | Complete |
| Lake Mixing | Buoy thermistor data from GLEON | Complete |
| Lake Modeling | GLEON | In testing 2016 |
| Stream Discharge | USGS Hydrologic Benchmark Network; USGS Real-Time Water Data | Complete |
| Water Quality | USGS Water Quality Watch Data | Finished testing |
| Nutrient Loading | USGS Water Quality Watch Data | Finished testing |
| Climate Change | NASA GISS; NOAA ESRL; NOAA NCDC | Finished testing |
| Soil Respiration | ORNL Carbon Dioxide Information Analysis Center; AmeriFlux | In testing 2016 |
| Seismology | IRIS | In testing 2016 |
| aESRL, Earth System Research Laboratory; GISS, Goddard Institute for Space Studies; GLEON, Global Lake Ecological Observatory Network; IRIS, Incorporated Research Institutions for Seismology; NCDC, National Climatic Data Center; NOAA, National Oceanic and Atmospheric Administration; NSIDC, National Snow and Ice Data Center; ORNL, Oak Ridge National Laboratory; USGS, U.S. Geological Survey. |
To support active learning, the modules use the 5Es learning cycle (engagement, exploration, explanation, extension, and evaluation), which has been shown by Bybee et al. [2006] to increase student interest in science, as well as to increase student mastery of sophisticated aspects of scientific reasoning.
Supporting Different Levels of Learning
Project EDDIE modules are divided into individual activities so that they can be used in a range of potential teaching environments and completed by students at different levels. Single activities can be assigned during a lecture period in an introductory course, whereas a series of activities may require a full laboratory session in an upper-level course. In the Stream Discharge module, for example, students might begin by examining discharge patterns in natural streams, using data in the USGS’s Hydrologic Benchmark Network. Because students have access to discharge measurements spanning many decades, they can look for patterns on daily, monthly, and annual time scales. Students must then grapple with the difficult task of identifying changes in discharge, through time or across sites, against this background of natural variability. This part of the activity might be sufficient for an hour-long class.
Alternatively, students in a 3-hour lab period might complete the first activity and move on to work on peak discharge and flood frequency. More advanced students might skip the first part entirely and go straight to an analysis of urbanization and flood frequency.

The Project EDDIE team has developed and tested modules using a variety of other sensor-based or long-term data sets. For instance, students working on the Climate Change module use the Mauna Loa carbon dioxide record and the Vostok ice core record to address questions about rates of change (Figure 2). The Soil Respiration module points students to ecosystem carbon dioxide flux data available from the University of Michigan Biological Station’s Ameriflux site and the Oak Ridge National Laboratory Carbon Dioxide Information Analysis Center. The Seismology module gives students practice with data from the Incorporated Research Institutions for Seismology. Several limnology modules use lake data available from the Global Lake Ecological Observatory Network and other sources (Table 1).
Does Project EDDIE Work?
Assessment of student learning is a critical component of Project EDDIE’s strategy. Careful assessment tells us whether our students are learning the skills necessary to manage and interpret large data sets. Beginning during the 2014–2015 academic year, participating students at eight different U.S. colleges completed premodule and postmodule surveys to measure how their understanding of concepts such as data variability, random processes, and data interpretation changed after working on a Project EDDIE module.
Preliminary results indicate that students felt more comfortable dealing with large data sets on a computer and more competent at manipulating data in spreadsheets.
Although assessment is not yet complete, preliminary results indicate that students felt more comfortable dealing with large data sets on a computer and more competent at manipulating data in spreadsheets after completing a module. In addition, students were more likely to use large sensor-based data sets to solve a scientific problem after engaging in a module, and their intuitive understanding of natural variation improved. A pilot study reported by Carey et al. [2015] indicates that working on modules improved students’ quantitative literacy and enabled them to grapple with difficult concepts such as data visualization and how resolution affects our ability to detect environmental changes.
Project team members continue to test and finalize existing modules and develop new ones. We are now beginning to focus on making Project EDDIE modules publicly available by posting modules in an online repository linked to the National Association of Geoscience Teachers’ Science Education Resource Center at Carleton College. We hope that access to these activities will help to overcome the “activation energy” of introducing students to sensor-based data.
Acknowledgments
Project EDDIE was made possible by a Transforming Undergraduate Education in Science (TUES) grant from the National Science Foundation (NSF DEB 1245707). Other members of the EDDIE team developed some of the modules discussed in this article, including Cayelan Carey (Virginia Tech), Randy Fuller (Colgate University), Cathy Gibson (Waterworks Analytics), Jennifer Klug (Fairfield University), Lucas Nave (University of Michigan Biological Station), David Richardson (State University of New York at New Paltz), and Janet Stomberg (Illinois State University). Project EDDIE is a sponsored program of the National Association of Geoscience Teachers and is supported by the Center for Mathematics, Sciences, and Technology at Illinois State University.
References
Benson, B. J., B. J. Bond, M. P. Hamilton, R. K. Monson, and R. Han (2010), Perspectives on next-generation technology for environmental sensor networks, Front. Ecol. Environ., 8, 193–200.
Bybee, R. W., J. A. Taylor, A. Gardner, P. Van Scotter, J. C. Powell, A. Westbrook, and N. Landes (2006), The BSCS 5E instructional model: Origins and effectiveness, Biol. Sci. Curric. Study, Colorado Springs, Colo.
Carey, C. C., R. Darner Gougis, J. L. Klug, C. M. O’Reilly, and D. C. Richardson (2015), A model for using environmental data-driven inquiry and exploration to teach limnology to undergraduates, Limnol. Oceanogr. Bull., 24, 2–5, doi:10.1002/lob.10020.
Langen, T. A., et al. (2014), Using large public datasets in the undergraduate ecology classroom, Front. Ecol. Environ., 12, 362–363.
Ledley, T. S., C. A. Manduca, and S. Fox (2008), Recommendations for making geoscience data accessible and usable in education, Eos Trans. AGU, 89, 291–292, doi:10.1029/2008EO320003.
Author Information
Nicholas E. Bader, Department of Geology, Whitman College, Walla Walla, Wash.; email: [email protected]; Dax Soule, School of Oceanography, University of Washington, Seattle; Devin Castendyk, Hatch Water and Tailings Management, Lakewood, Colo.; Thomas Meixner, University of Arizona, Tucson; and Catherine O’Reilly and Rebekka Darner Gougis, Illinois State University, Normal
Citation: Bader, N. E., D. Soule, D. Castendyk, T. Meixner, C. O’Reilly, and R. D. Gougis (2016), Students, meet data, Eos, 97, doi:10.1029/2016EO047175. Published on 2 March 2016.
Text © 2016. The authors. CC BY-NC 3.0
Except where otherwise noted, images are subject to copyright. Any reuse without express permission from the copyright owner is prohibited.