
Bhattacharya et al. present evidence that expansion of the North American Monsoon explains a wetter southwest in the mid-Pliocene and suggest this mechanism can explain current monsoon variations.
AGU Advances

Posted inEditors' Highlights
Differential Evolution of the Pacific Oxygen Minimum Zones
The latest generation of Earth System models simulate an expansion of the oxygen minimum zones in the Pacific, but their inner core, where oxygen levels drop to near zero, contracts in the future.

Posted inEditors' Highlights
Good Trouble in Committees
Assigned to another committee? “Ugh,” you say. Think again, and read this article to see how that committee could be an engine of diversity for your organization and for the geosciences.

Posted inEditors' Highlights
Winter Arctic Heatwave Drives Summer Impacts in Siberia
A cascade of land-atmosphere interactions resulting from a winter heatwave in Siberia led to significant summer impacts that further exacerbated the heatwave effects on the region.
Posted inEditors' Highlights
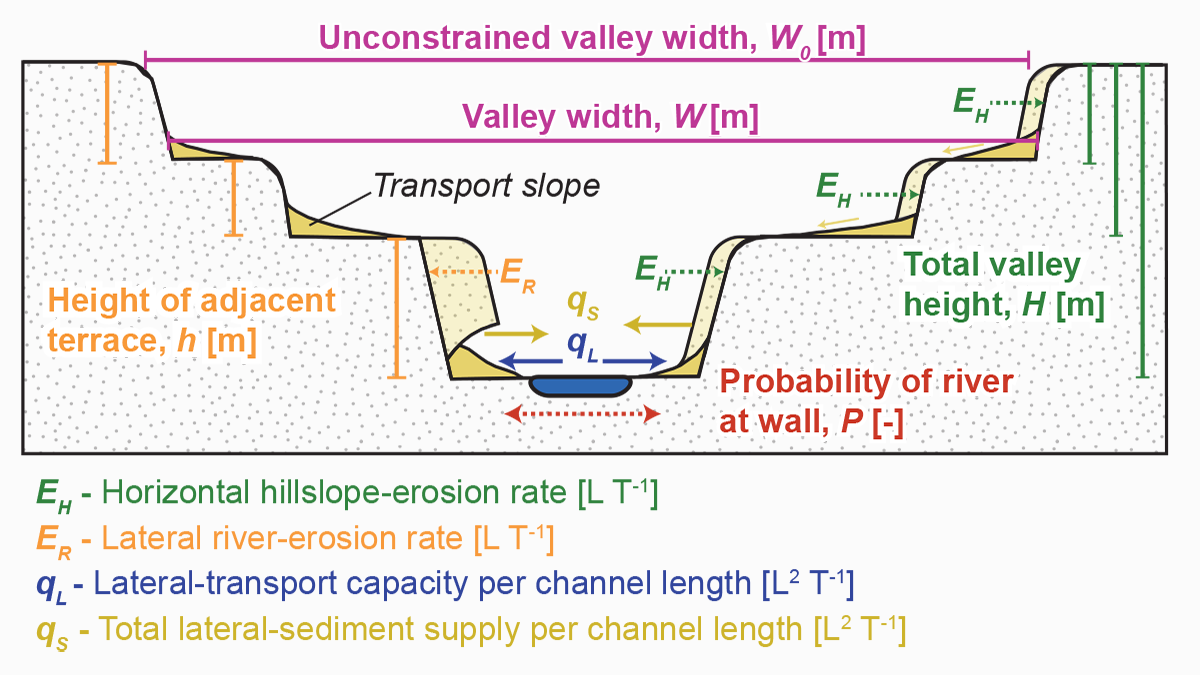
Why Do Fluvial Valleys Behave So Differently?
Source: AGU Advances Editors’ Highlights are summaries of recent papers by AGU’s journal editors. The shape of fluvial valleys results from the complex interaction between climate and the local environment. Our current knowledge suggests that river discharge and valley-wall lithology are the main controls on valley width. Yet, current models based on these observations fail […]
Posted inEditors' Highlights
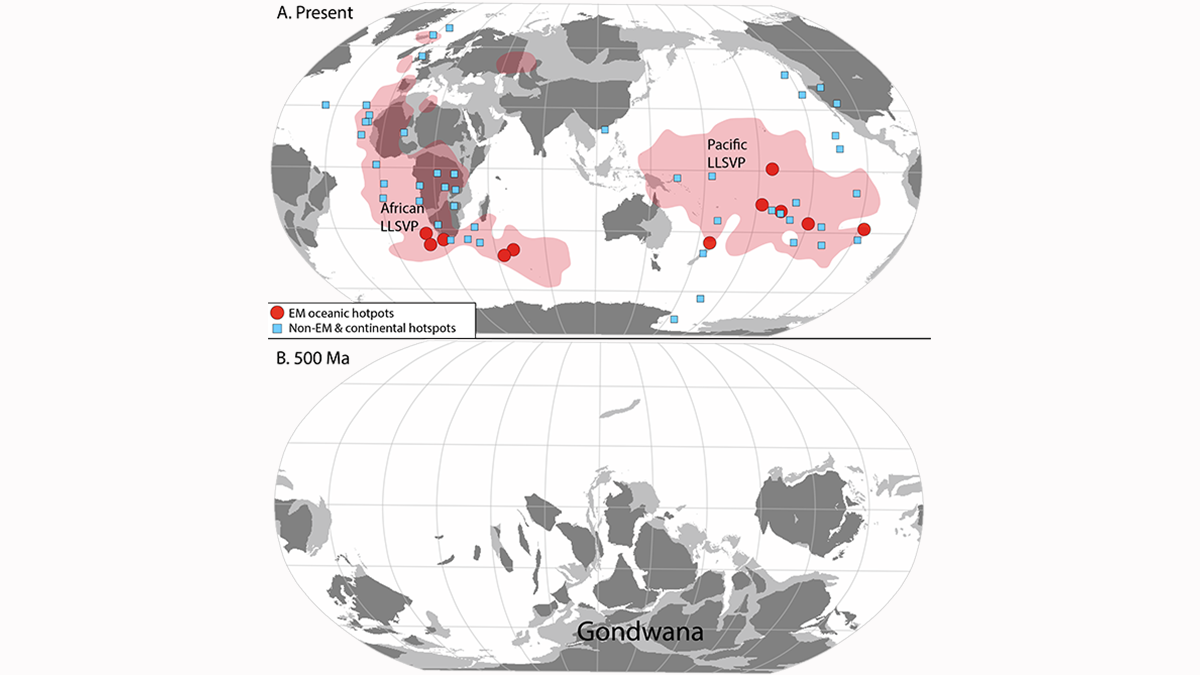
The Crust Travels to the Earth’s Core and Back in Record Time
Subduction of continental crust around the Gondwana supercontinent may explain the mantle Dupal anomaly of the southern hemisphere.

Posted inEditors' Highlights
Outsourcing the Work of Industrial Climate Science
Climate science is increasingly structured in ways that subcontract repetitive activities to graduate students. Here, early career researchers raise the issue and explore some tradeoffs.
Posted inEditors' Highlights
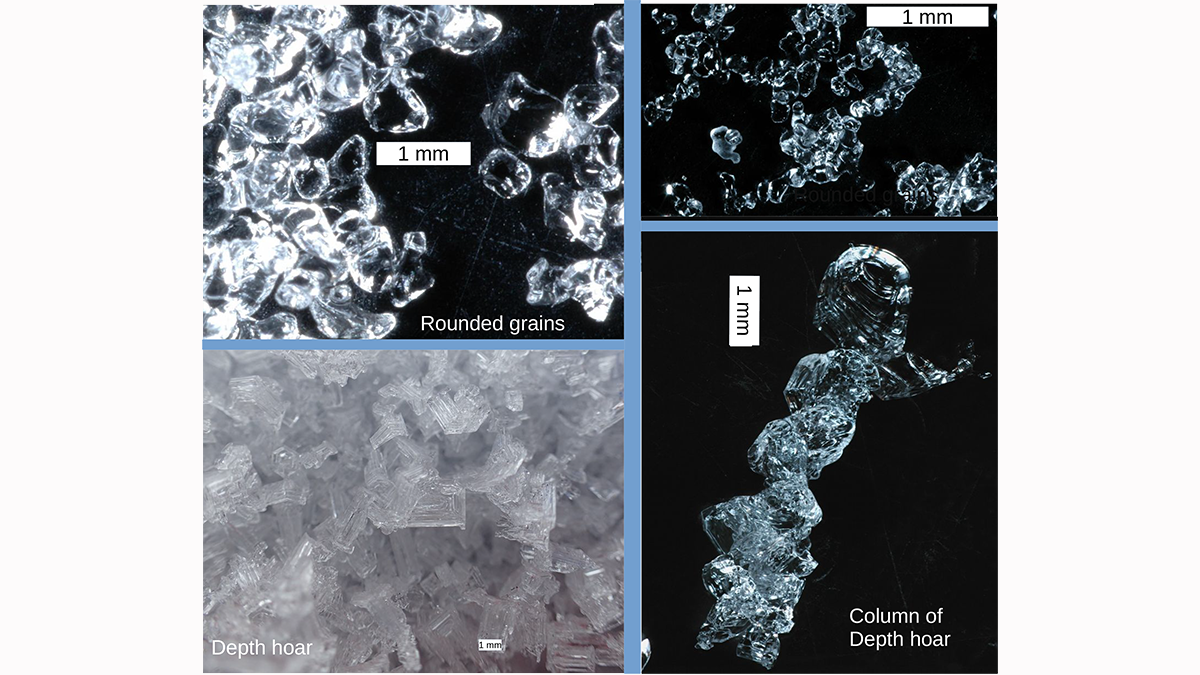
Measuring the Microstructure of Snow from Space
There is more to snow than flakes. Microwave measurements are shown to be capable of illuminating the microstructure of snow in ways that will improve our ability to monitor snow fields from space.
Posted inEditors' Highlights
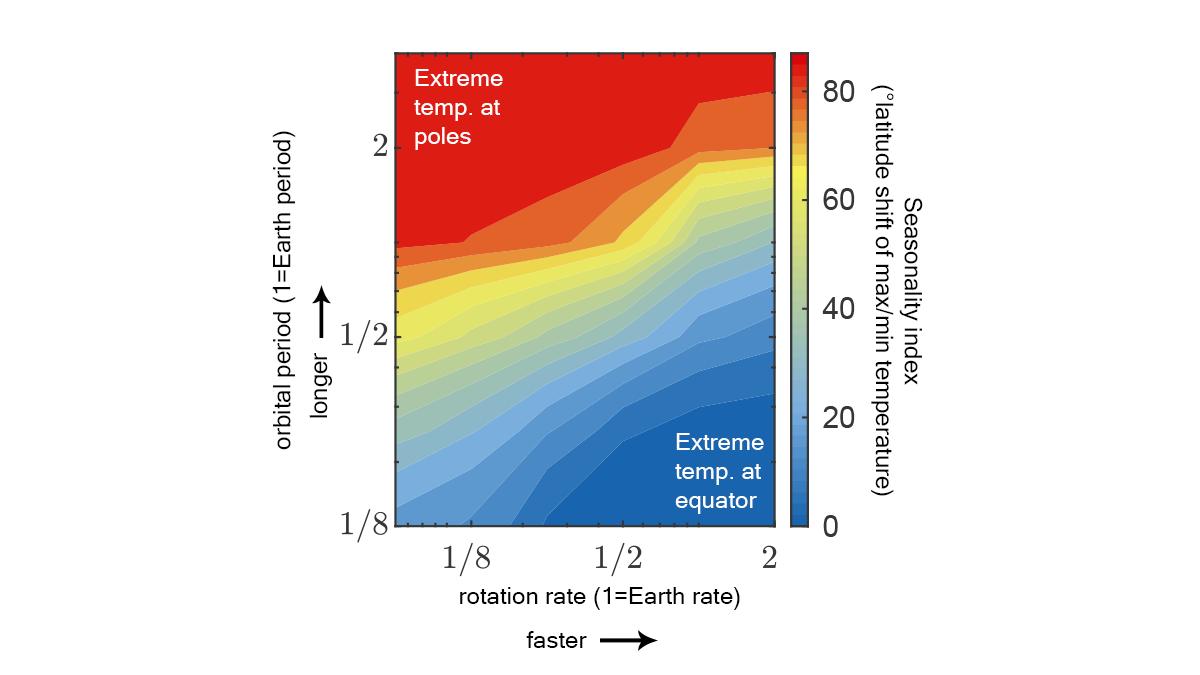
Extremeness of Seasons Determined by Planetary Motion Parameters
We’ve long known that a planet’s orbital period and tilt determine length and intensity of seasons. We now see rotation rate matters too: max temperature shifts poleward as rotation slows.
Posted inEditors' Highlights
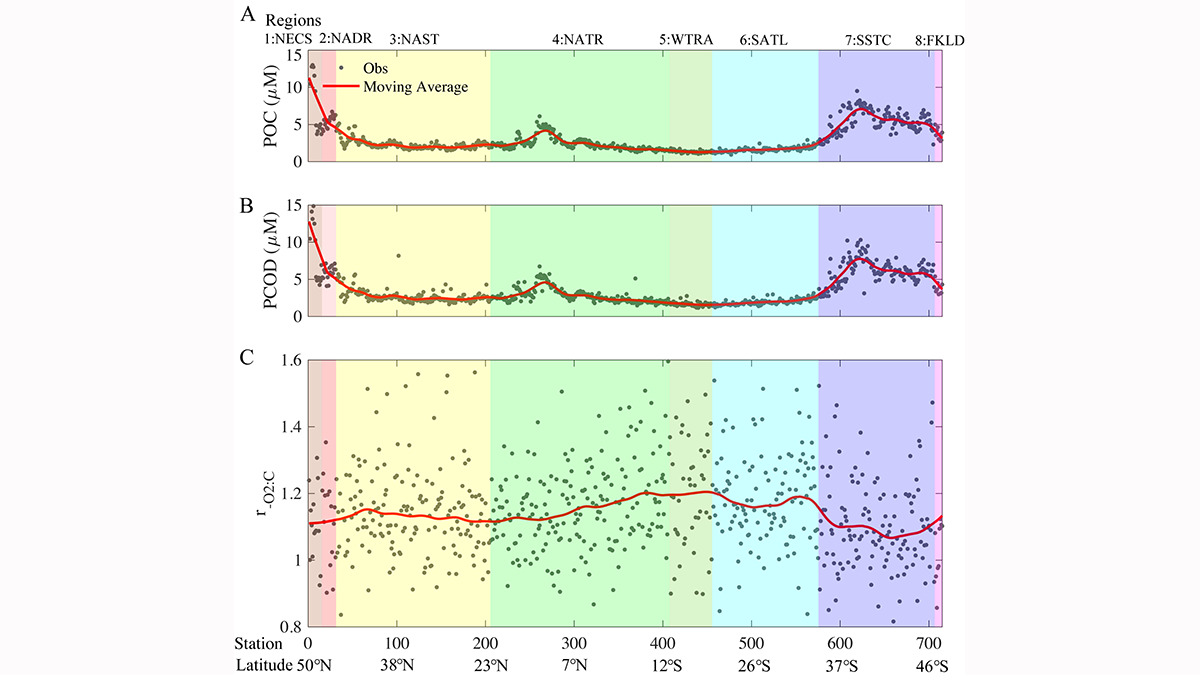
Respiration Quotient Variability and Ocean Oxygen Levels
Respiration quotients in the Atlantic and Pacific Oceans reflect different water temperature, nutrient stress and phytoplankton community structure, important for regional carbon and oxygen cycling.