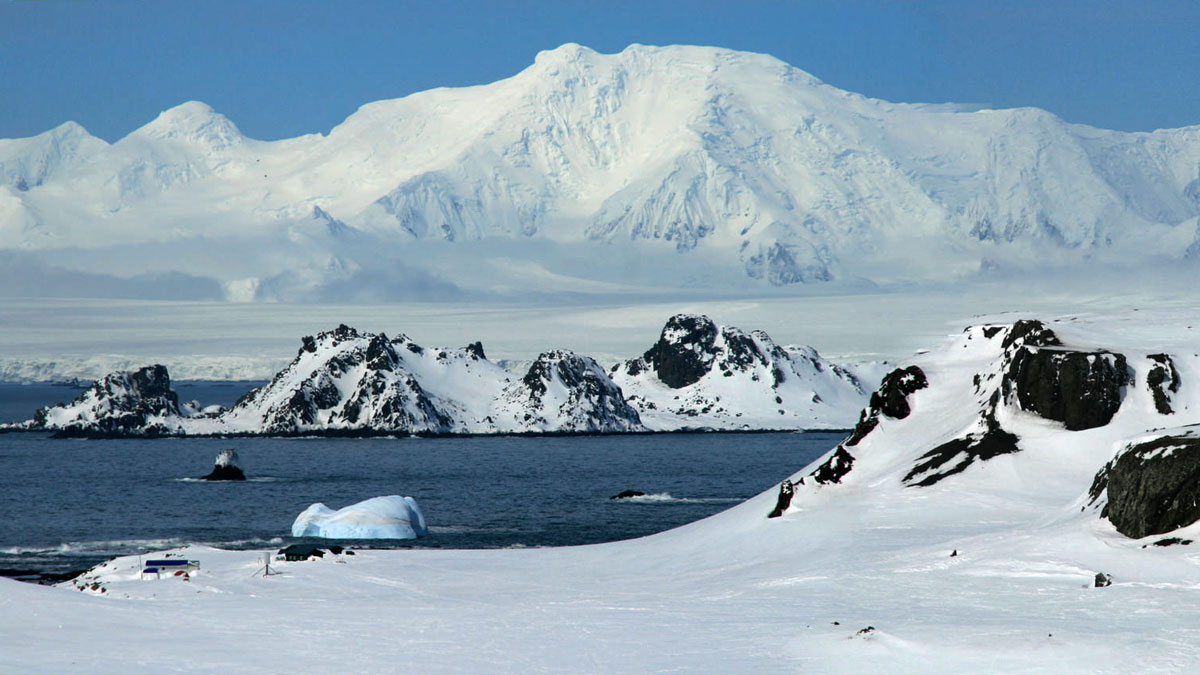
Cold surface water in the Southern Ocean is a critical component in ocean carbon uptake. A new study profiles it using state-of-the-art research techniques.
AGU Advances
Posted inEditors' Highlights
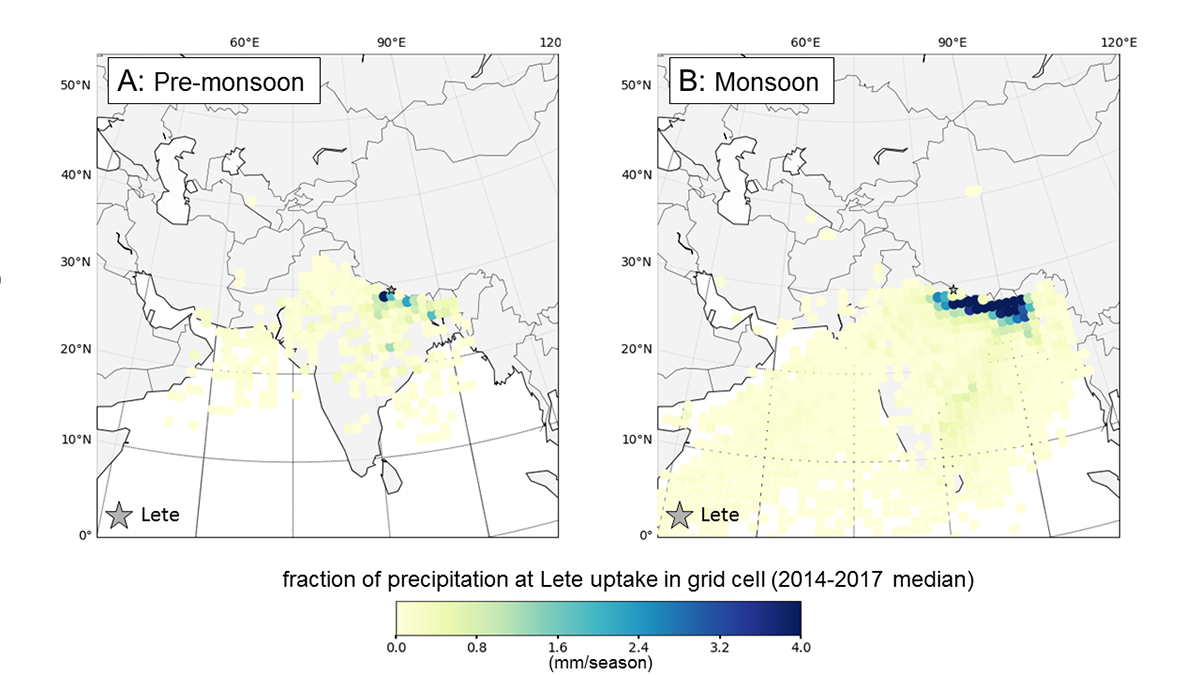
Source of Precipitation Moisture Feeding Himalayan Rivers
Isotope study showing the partitioning of moisture into snow, ice, and groundwater allows an understanding of the relative contribution to river flow to show where Himalayan river water comes from.
Posted inEditors' Highlights
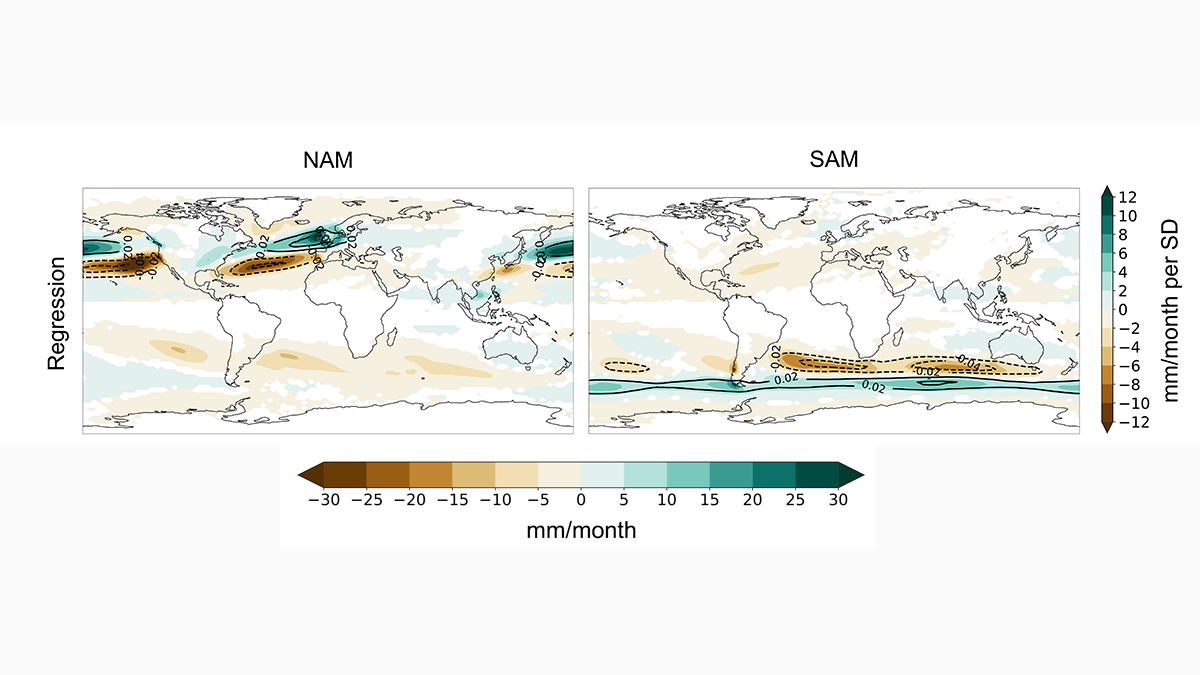
How Do Atmospheric Rivers Respond to Extratropical Variability?
Atmospheric river variability over the last millennium is primarily driven by north-south displacements in zonal winds induced by the annular modes.

Posted inEditors' Highlights
How Can We Sample More Ethically?
Ryan-Davis and Scalice describe a path towards sampling more ethically, going beyond legal permitting requirements to engagement of Indigenous expertise and respect of peoples’ relationship to place.
Posted inEditors' Highlights
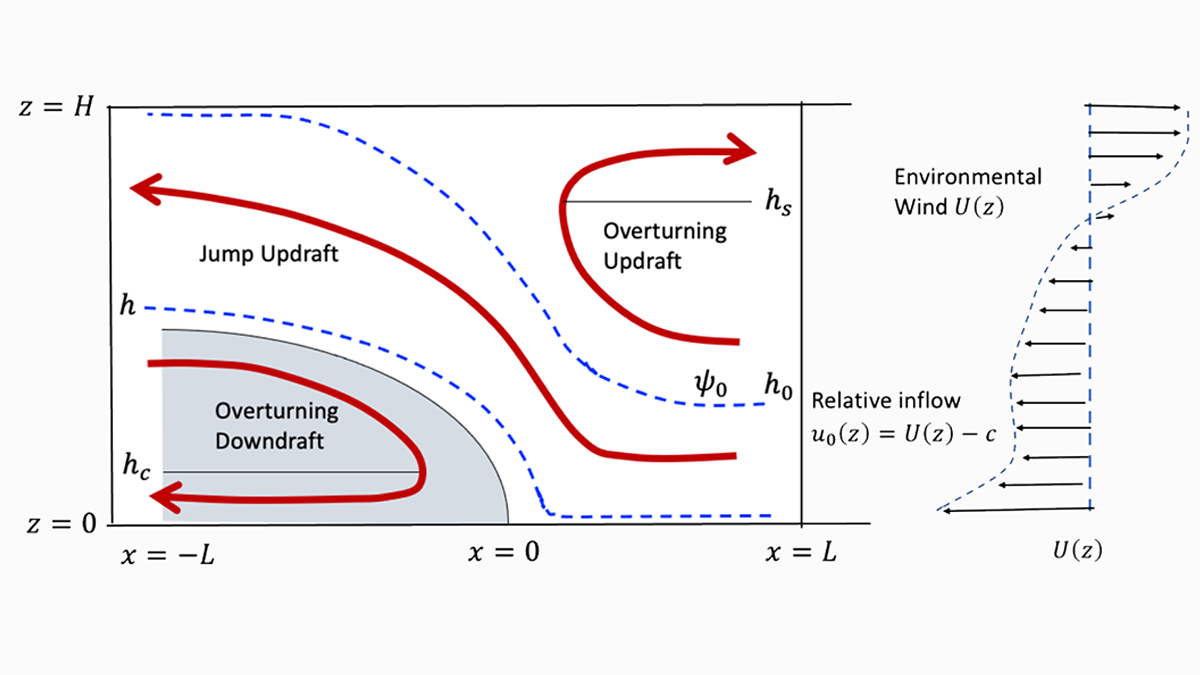
A Theory of Squall Lines
About 50 years ago, vorticity thinking helped unveil basic properties of squall lines. Zhang now provides a closed theory, demystifying one of nature’s most important forms of convective organization.
Posted inEditors' Highlights
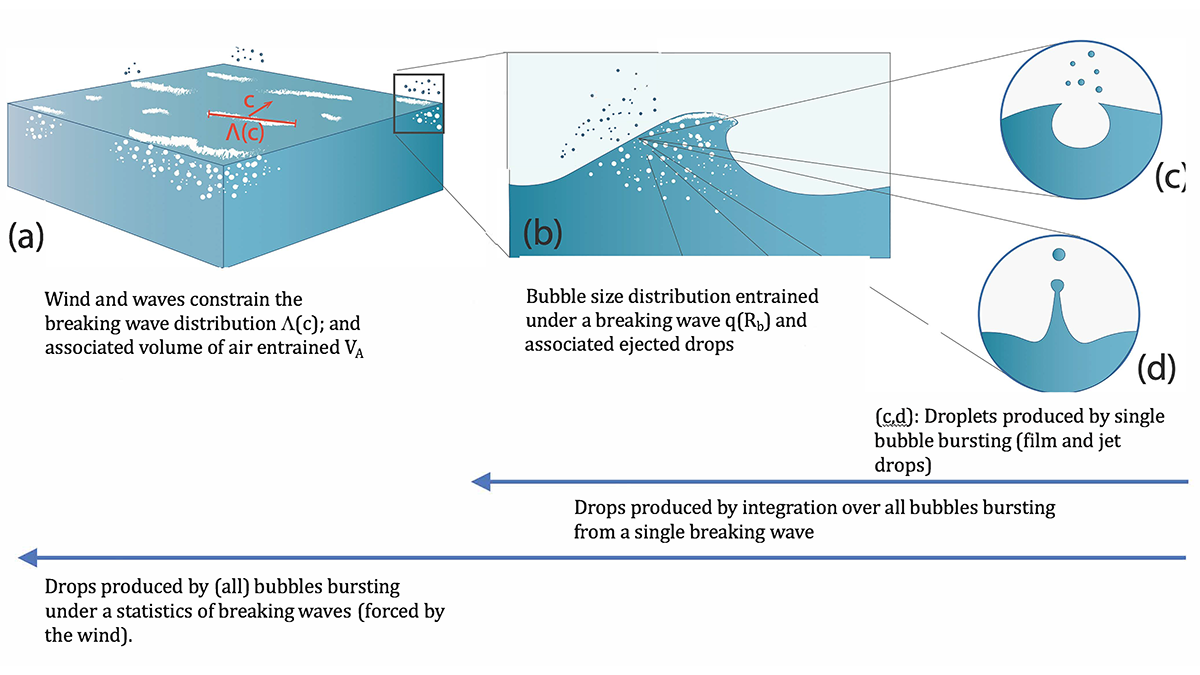
A New Approach to Sea Spray Aerosol Production and Prediction
Sea spray aerosols play a critical role in atmospheric processes. A new approach is in strong agreement with observations, paving the way for improved models of atmospheric aerosols of oceanic origin.

Posted inEditors' Highlights
First in Line to Track Blue Water From Space
“Blue water” is the water in rivers, lakes, and reservoirs. A new NASA mission will track blue water levels globally at least once a month. Early Adopters are eager and ready to use the data!

Posted inEditors' Highlights
Roadside Plants Witness COVID Traffic
Radiocarbon in roadside plants revealed a decline in auto emissions during COVID lockdown and a 2021 rebound. Could this improve emission estimates in countries without CO2 monitoring infrastructure?
Posted inEditors' Highlights
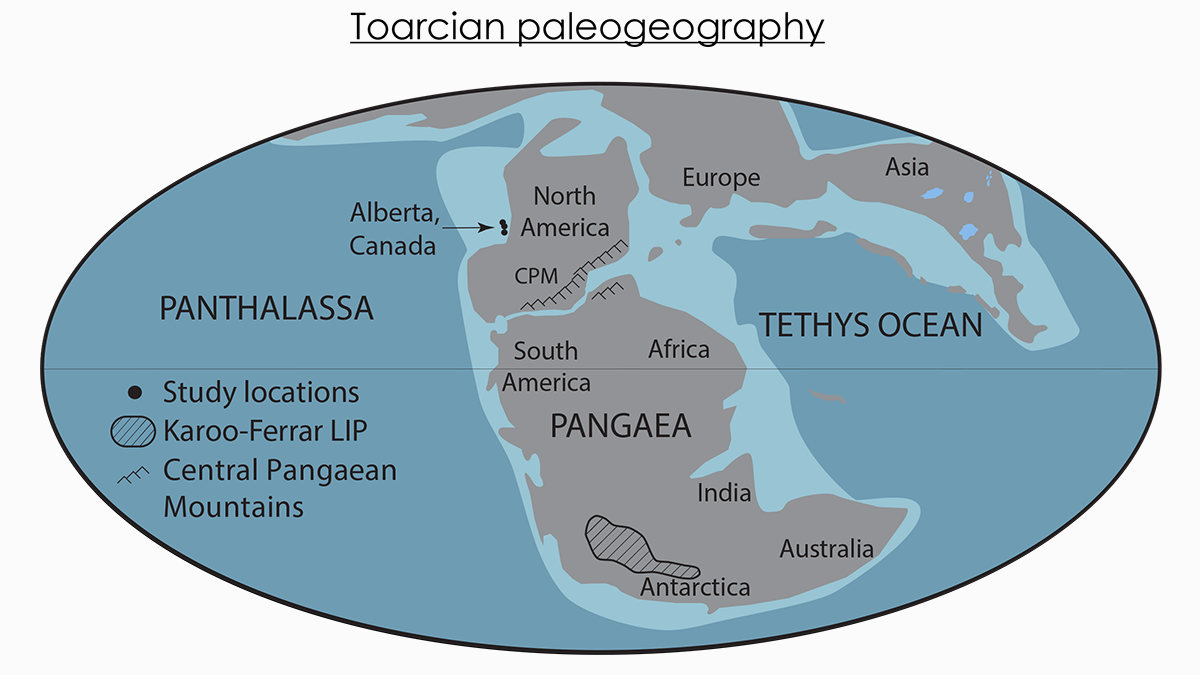
Marine Molybdenum Loss During the Toarcian Ocean Anoxic Event
The reconstructed loss of molybdenum during the Toarcian ocean anoxic event suggests deeply anoxic conditions during this time period allowing massive amounts of organic carbon being buried.

Posted inEditors' Highlights
Eminently Complex – Climate Science and the 2021 Nobel Prize
The 2021 Nobel Prize in Physics was awarded for climate modeling and for the discovery of multifractals to describe intermittency and the scaling dynamics of climate variables, including extremes.