Source: AGU Advances
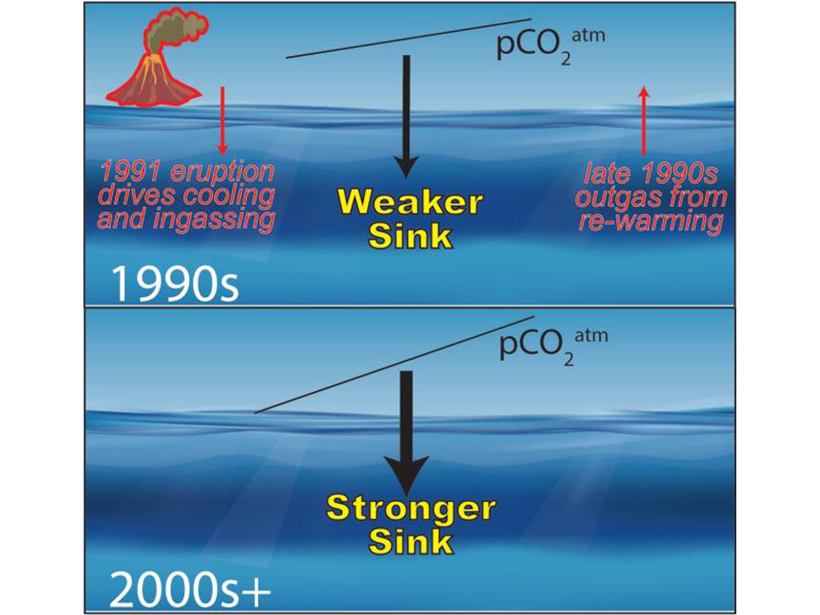
The ocean’s capacity to take up carbon is a balance between the amount of carbon dioxide in the atmosphere and the state of the ocean. Reduced emissions in the 1990s resulted in lower atmospheric carbon dioxide, which slowed the ocean’s uptake of carbon. At the same time, the eruption of Mount Pinatubo in 1991 produced cooler sea surface temperatures followed by warming in the latter part of the decade that changed the state of the ocean, which, in turn, shifted the timing of the carbon sink slowing.
McKinley et al. [2020] now provide a model-based analysis that evaluates the ocean’s response when these two effects coincided, to explain the slowing of the ocean carbon sink during the 1990s. The confluence of these events yielded a net carbon uptake by the ocean that was less than expected. These results highlight the importance of external processes in controlling decadal variability in the ocean carbon sink and point to the uncertainty introduced by extreme events.
Citation: McKinley, G., Fay, A., Eddebbar, Y., Gloege, L, & Lovenduski, N. [2020]. External forcing explains recent decadal variability of the ocean carbon sink. AGU Advances, 2, e2019AV000149. https://doi.org/10.1029/2019AV000149
—Eileen Hofmann, Editor, AGU Advances
Read more highlights from AGU Advances: agu.org/advances-digest
Text © 2020. The authors. CC BY-NC-ND 3.0
Except where otherwise noted, images are subject to copyright. Any reuse without express permission from the copyright owner is prohibited.

