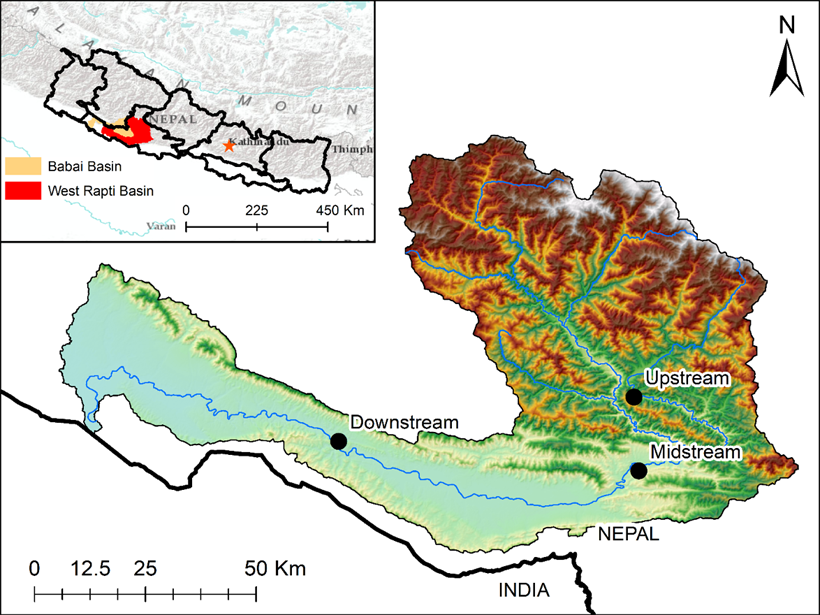
A new study corrects poor-performing satellite-based rainfall estimates with gauge data and also fills gauge data gaps using well-performing satellite-based rainfall estimates.
Earth and Space Science

Posted inEditors' Vox
Understanding and Anticipating Induced Seismicity
A new special collection in JGR: Solid Earth and Earth and Space Science seeks papers from across disciplines that provide insights into induced seismicity at different spatial and temporal scales.
Posted inEditors' Highlights
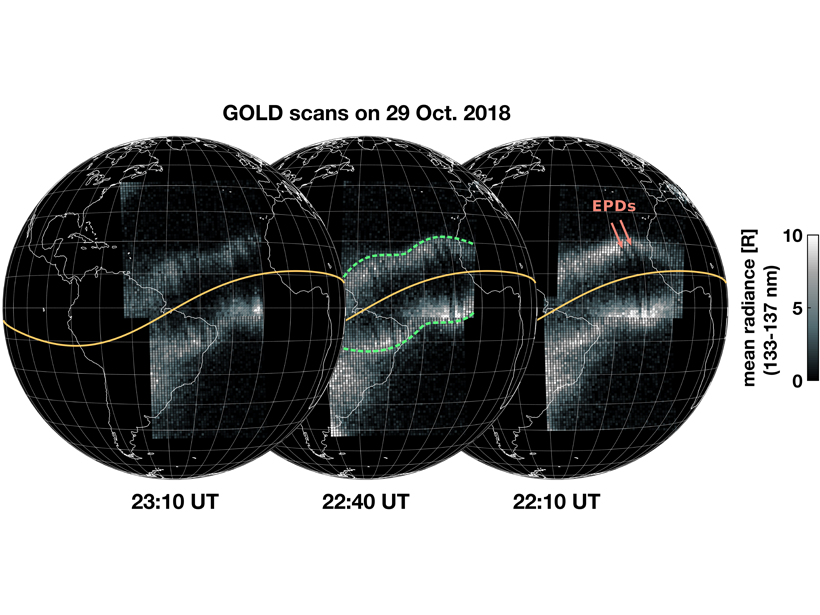
GOLD Sees Quasi-Stationary Waves in the Nighttime Ionosphere
The wave-like features in the pre-midnight ionosphere are not moving, vary strongly from day-to-day, and are often associated with the equatorial plasma bubbles, but their origin is still unknown.
Posted inEditors' Highlights
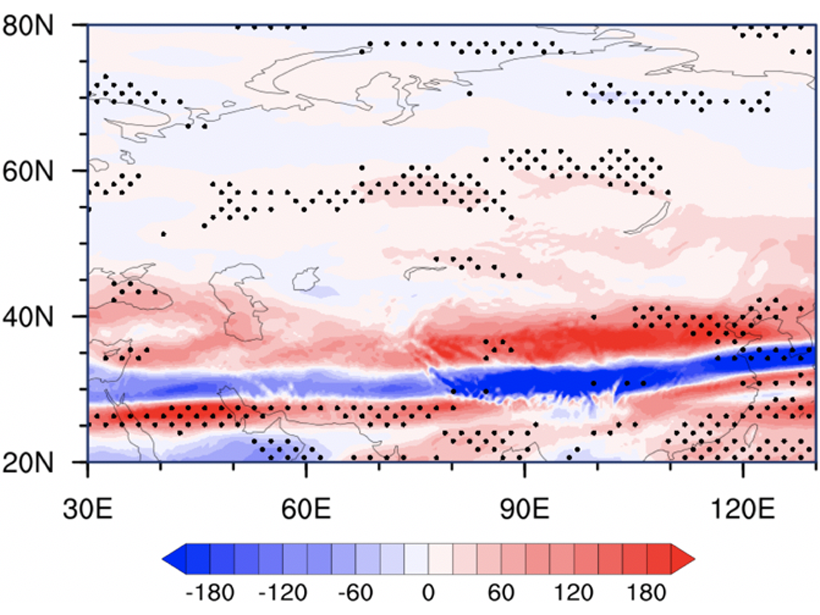
Global Warming Intensifies Turbulence Over Northern Eurasia
A significant increasing trend of turbulence in upper atmosphere over northern Eurasia is attributed to intense anthropogenic activities.
Posted inEditors' Highlights
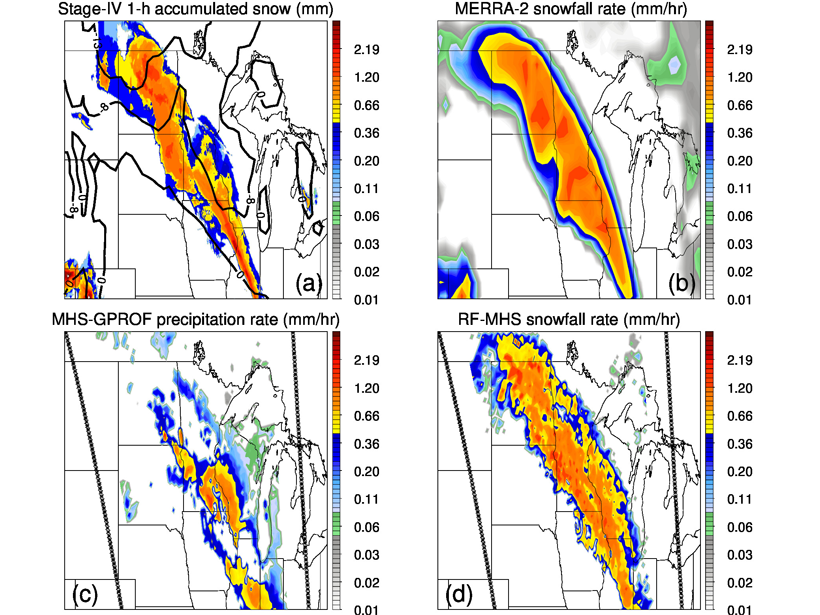
Using Machine Learning to Detect and Estimate Global Snowfall
Machine learning is used to retrieve global snowfall occurrence and rate from satellite-based passive microwave sounder observations, trained by snowfall data from a high-quality space borne radar.
Posted inResearch Spotlights
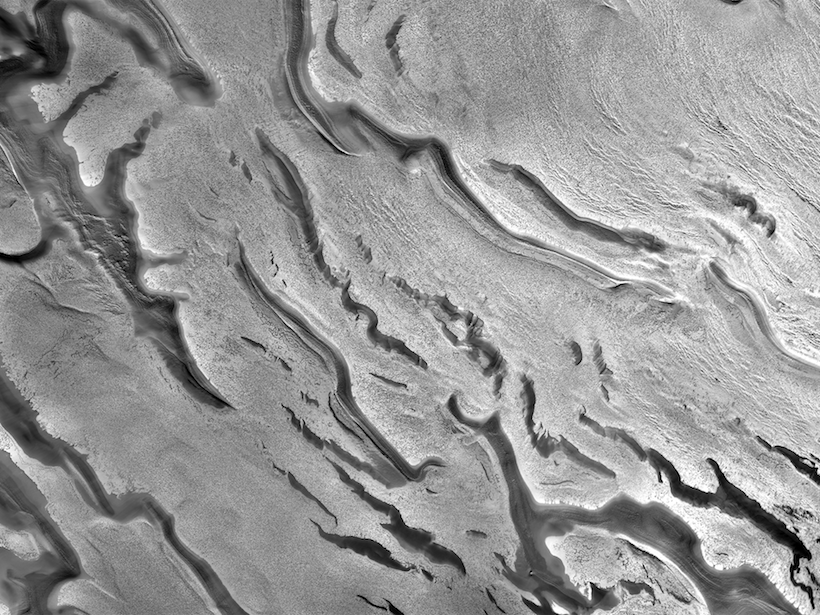
A Precise Mosaic View of Mars’s South Pole
A new workflow improves the process of creating massive, accurate mosaics from spacecraft-captured images of a planet’s surface.

Posted inEditors' Highlights
Zero-valent Iron in the Oxidizing Atmosphere?
A comparative study of urban, semi-urban, and rural sites reveals that the species of atmospheric iron varies depending on location.

Posted inEditors' Vox
Up Close with an Active Asteroid
A new journal special collection investigates the ejection of particles from the asteroid Bennu and the implications of these observations for asteroid science.
Posted inEditors' Highlights
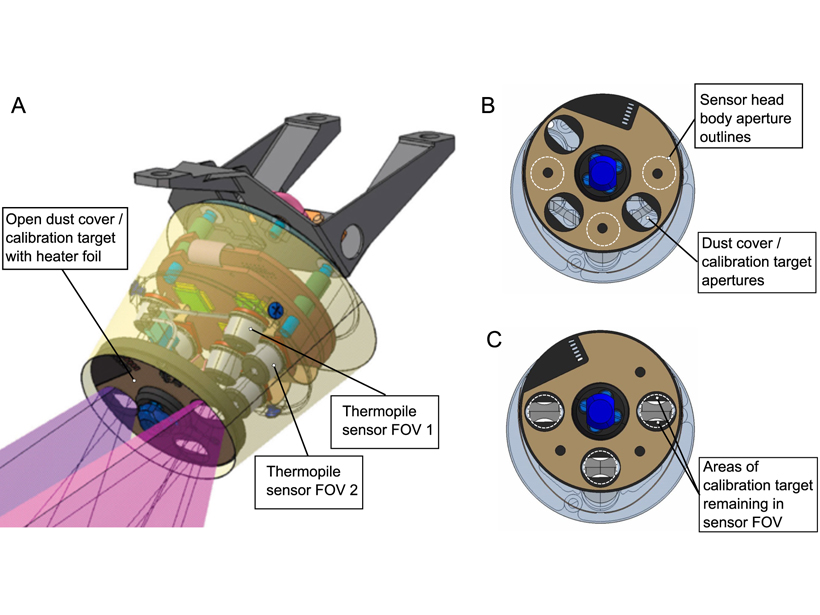
Insights from Calibration of the HP³ Radiometer on InSight
A detailed analysis of Heatflow and Physical Properties Package Radiometer on the Mars InSight lander, including changing instrument sensitivity and calibration coefficients.

Posted inEditors' Highlights
Who Wants to Count All the Craters on Mars? Not Me!
Humans found hundreds of thousands of craters on Mars greater than 1 kilometer in diameter, but now computers automate the process delivering crater counts as well as geologically meaningful ages.