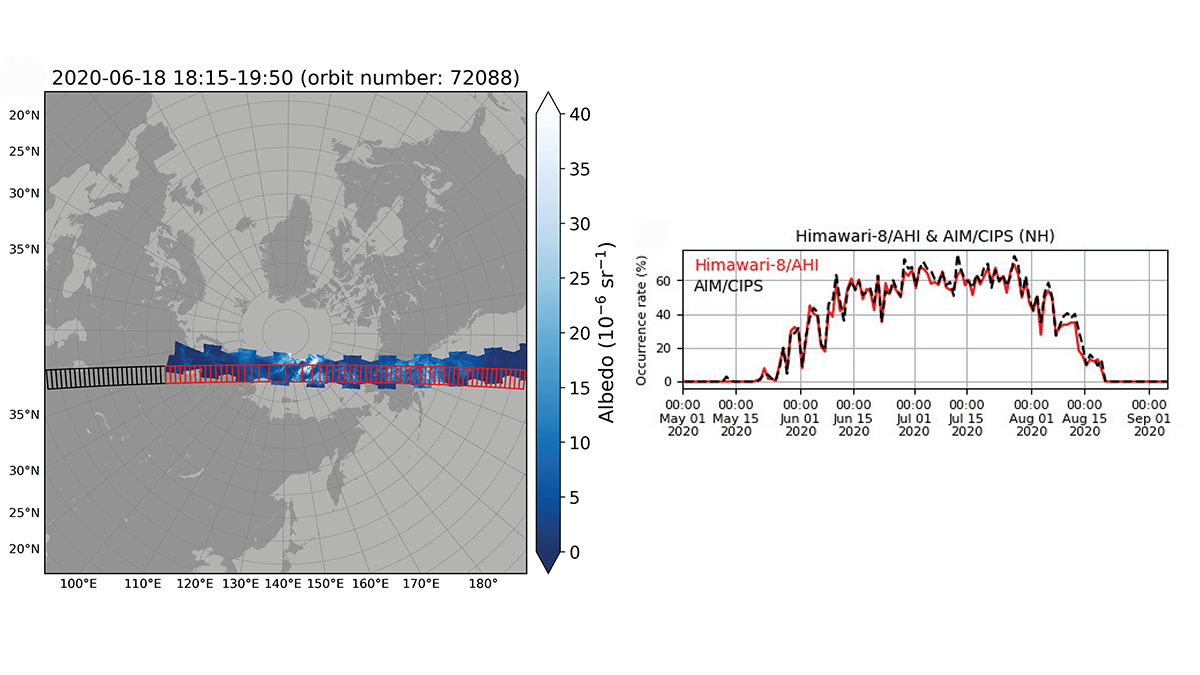
A new two-step Polar Mesospheric Cloud detection technique is applied towards the Himawari-8/Advanced Himawari Imager full-disk images leading to a new high-quality dataset.
Earth and Space Science
Posted inEditors' Highlights
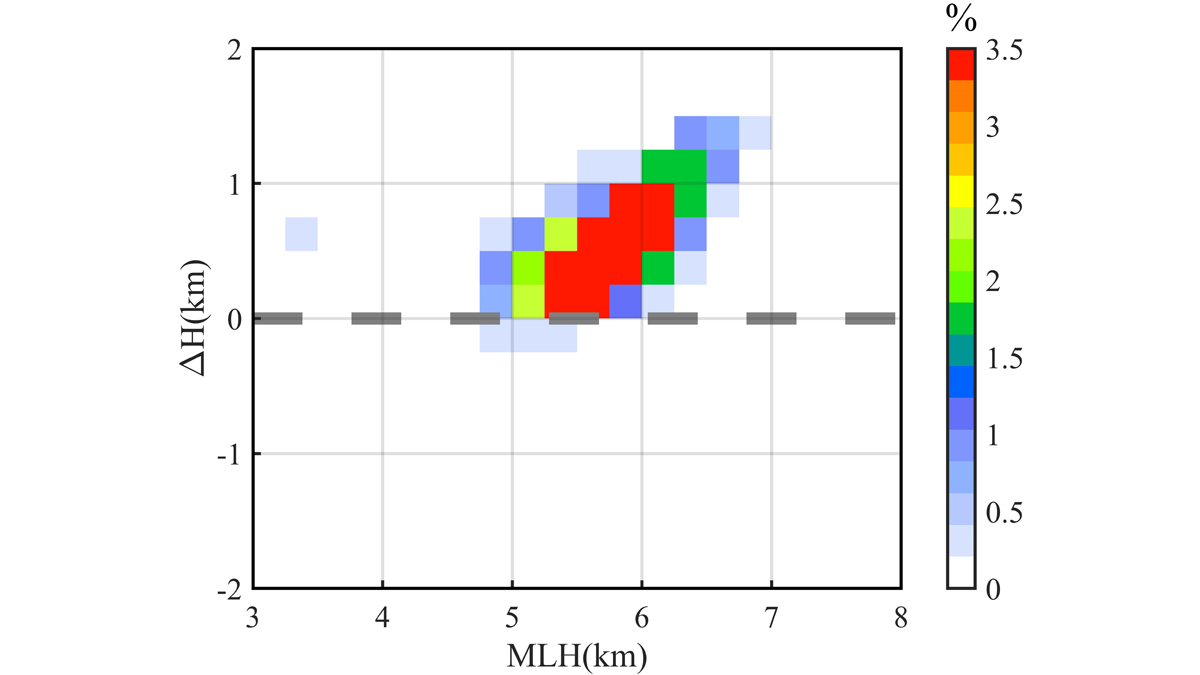
Melting Layer Characteristics of Cyclones
Dual‐frequency Precipitation Radar observations reveal the characteristics and microphysical processes of the melting layer in cyclone precipitation over the western North Pacific.

Posted inResearch Spotlights
Finding Moons’ Hidden Oceans with Induced Magnetic Fields
A principal component analysis of speculative models can more confidently predict the presence of a planetary object’s subsurface ocean than previous techniques.
Posted inResearch Spotlights
How Do Marine Gases Affect Cloud Formation?
By using novel aircraft measurements over the eastern North Atlantic Ocean, researchers shed light on the relationship between common marine biogenic gases and the microphysical properties of clouds.


Posted inEditors' Vox
The Mystery of Methane on Mars Thickens
Two recently published papers zoom in on the mystery source of methane in the Martian atmosphere.

Posted inEditors' Vox
Introducing the New Editor in Chief of Earth and Space Science
Find out about the person taking the helm of Earth and Space Science and her vision for the coming years.

Posted inResearch Spotlights
Scientists Turn Back Time to Track Methane Emissions on Mars
Period spikes of methane on Mars could originate inside Gale crater, where NASA’s Curiosity rover is currently exploring.s

Posted inResearch Spotlights
Machine Learning Algorithms Help Scientists Explore Mars
Researchers applied machine learning algorithms to several distinct chemical compositions of Mars and suggest that these algorithms could be a powerful tool to map the planet’s surface on a large scale.

Posted inEditors' Highlights
Polar Vortex Linked to Atmospheric Circulation at Daily Scale
A simplified representation of polar vortex at monthly scale was revised using a new method, and its daily association with air-sea teleconnections was analyzed to study weather impacts.