• About
  • Special Reports
  • Topics
    • Climate
    • Earth Science
    • Oceans
    • Space & Planets
    • Health & Ecosystems
    • Culture & Policy
    • Education & Careers
    • Opinions
  • Projects
    • Postcards From the Field
    • ENGAGE
    • Editors’ Highlights
    • Editors’ Vox
    • Eos en Español
    • Eos 简体中文版
    • Print Archive: 2015–2025
  • Policy Tracker
  • Blogs
    • Research & Developments
    • The Landslide Blog
  • Newsletter
  • Submit to Eos
  • AGU.org
  • Career Center
  • Join AGU
  • Give to AGU
  • About
  • Special Reports
  • Topics
    • Climate
    • Earth Science
    • Oceans
    • Space & Planets
    • Health & Ecosystems
    • Culture & Policy
    • Education & Careers
    • Opinions
  • Projects
    • Postcards From the Field
    • ENGAGE
    • Editors’ Highlights
    • Editors’ Vox
    • Eos en Español
    • Eos 简体中文版
    • Print Archive: 2015–2025
  • Policy Tracker
  • Blogs
    • Research & Developments
    • The Landslide Blog
  • Newsletter
  • Submit to Eos
Skip to content
  • AGU.org
  • Career Center
  • Join AGU
  • Give to AGU
Eos

Eos

Science News by AGU

Support Eos
Sign Up for Newsletter
  • About
  • Special Reports
  • Topics
    • Climate
    • Earth Science
    • Oceans
    • Space & Planets
    • Health & Ecosystems
    • Culture & Policy
    • Education & Careers
    • Opinions
  • Projects
    • Postcards From the Field
    • ENGAGE
    • Editors’ Highlights
    • Editors’ Vox
    • Eos en Español
    • Eos 简体中文版
    • Print Archive: 2015–2025
  • Policy Tracker
  • Blogs
    • Research & Developments
    • The Landslide Blog
  • Newsletter
  • Submit to Eos

Earth’s interior

Graph from the paper
Posted inEditors' Highlights

The Depleted Mantle Merry-Go-Round 

by Vincent Salters 5 April 20234 August 2023

Abyssal peridotites show through their isotopic composition a complex history. From differences we can infer the existence of ultra depleted mantle and an uneven contribution to ridge magmatism.

Image depicting Viscosity estimates for the mantle underneath Greenland.
Posted inEditors' Highlights

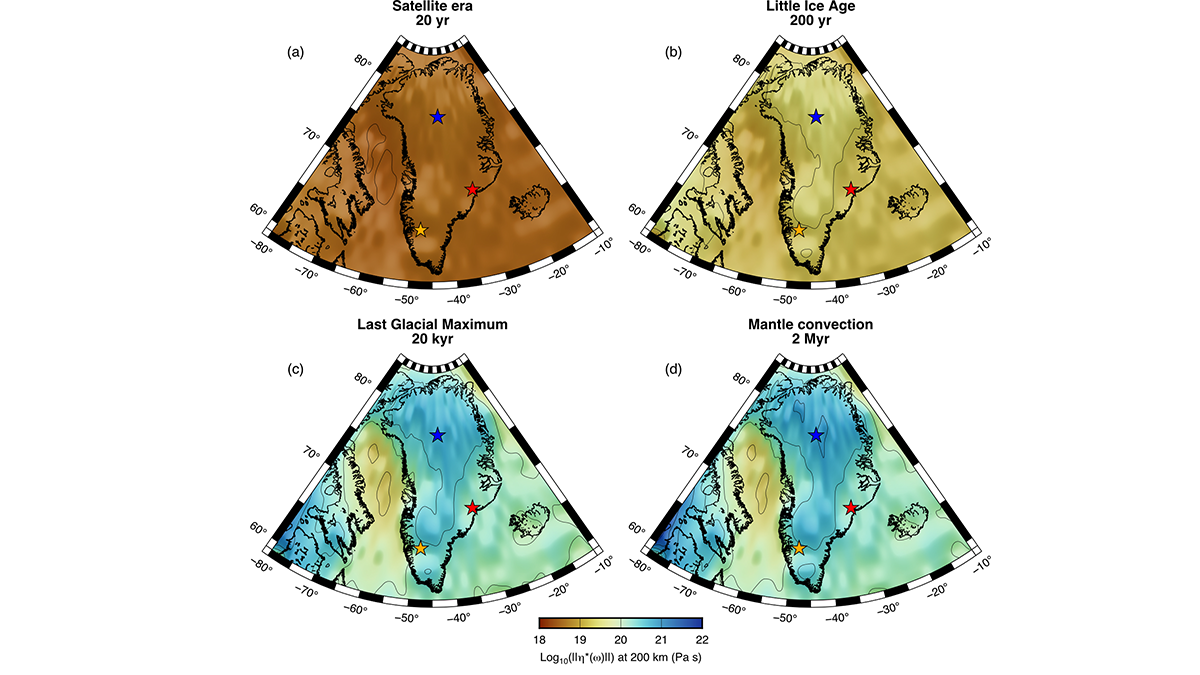
4D Viscosity Constraints from Greenland 

by Thorsten Becker 28 March 202311 April 2023

The mantle’s resistance to flow appears different for glacial and plate tectonic timescales but this behavior can be reconciled with new thermo-mechanical models of the asthenosphere.

一个球形海底地震仪下降到海面
Posted inResearch Spotlights

小尺度对流搅动大洋岩石圈

Sarah Derouin, Science Writer by Sarah Derouin 6 March 20236 March 2023

海底扩张将岩石圈矿物组织成一个晶格,但小规模的对流混杂在最内层。

Ropy black basalt solidifies, with orange-red lava visible, like embers in a fire.
Posted inNews

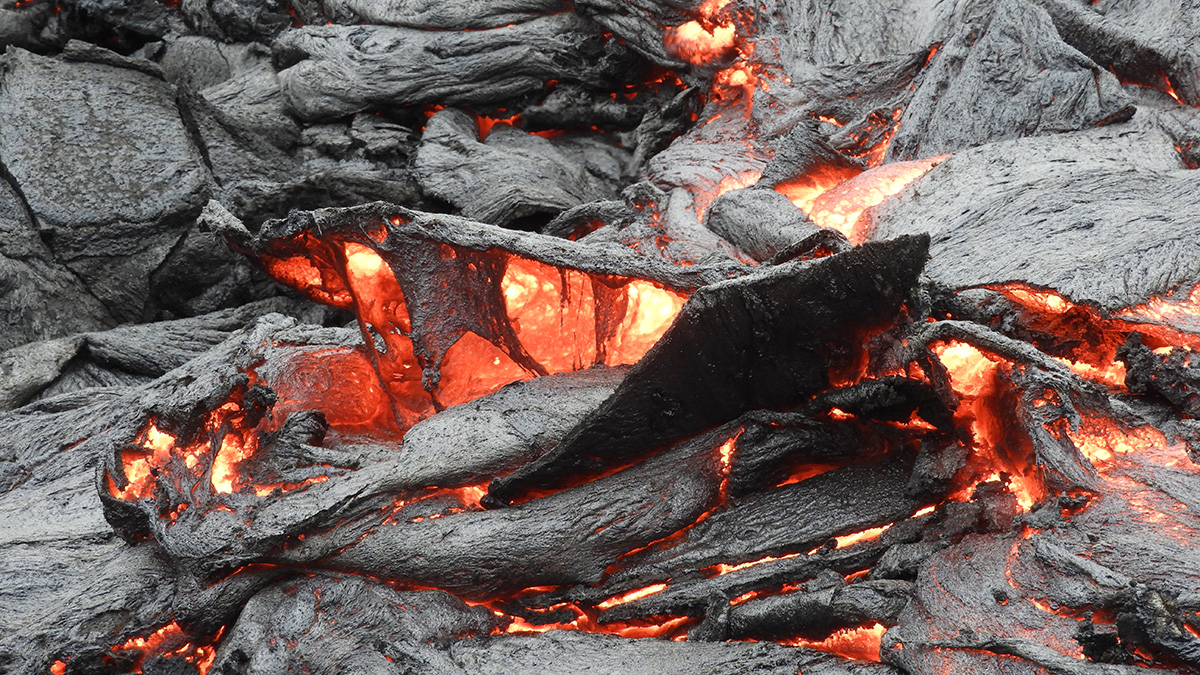
Crystals Track Magma Movement Beneath Iceland

by Alka Tripathy-Lang 28 February 202319 July 2023

Crystals from Fagradalsfjall’s eruption mark how mantle magma might have been moving years before geophysical indicators alerted scientists to unrest.

An orb-shaped ocean bottom seismometer descending into the sea surface
Posted inResearch Spotlights

Small-Scale Convection Shuffles the Oceanic Lithosphere

Sarah Derouin, Science Writer by Sarah Derouin 21 February 20238 July 2024

Seafloor spreading organized lithospheric minerals into a lattice, but small-scale convection jumbled up the innermost layer.

Posted inEditors' Highlights

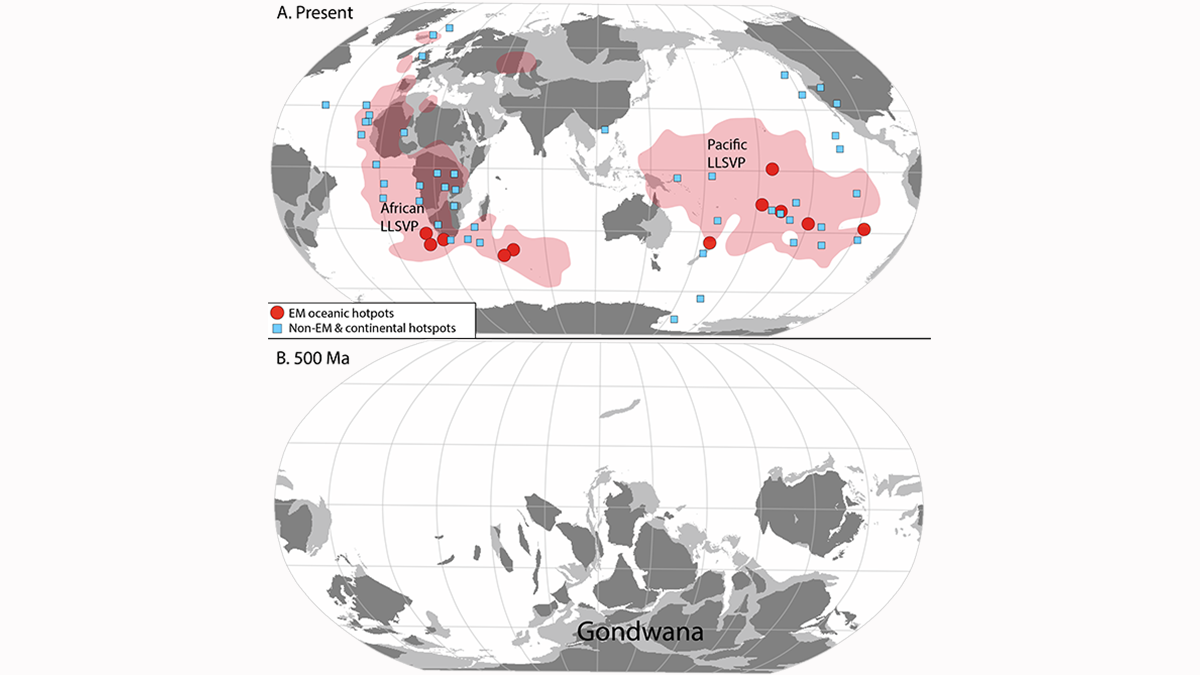
The Crust Travels to the Earth’s Core and Back in Record Time

by Vincent Salters 16 December 20228 February 2023

Subduction of continental crust around the Gondwana supercontinent may explain the mantle Dupal anomaly of the southern hemisphere.

Two maps showing locations of seismic arrays.
Posted inEditors' Highlights

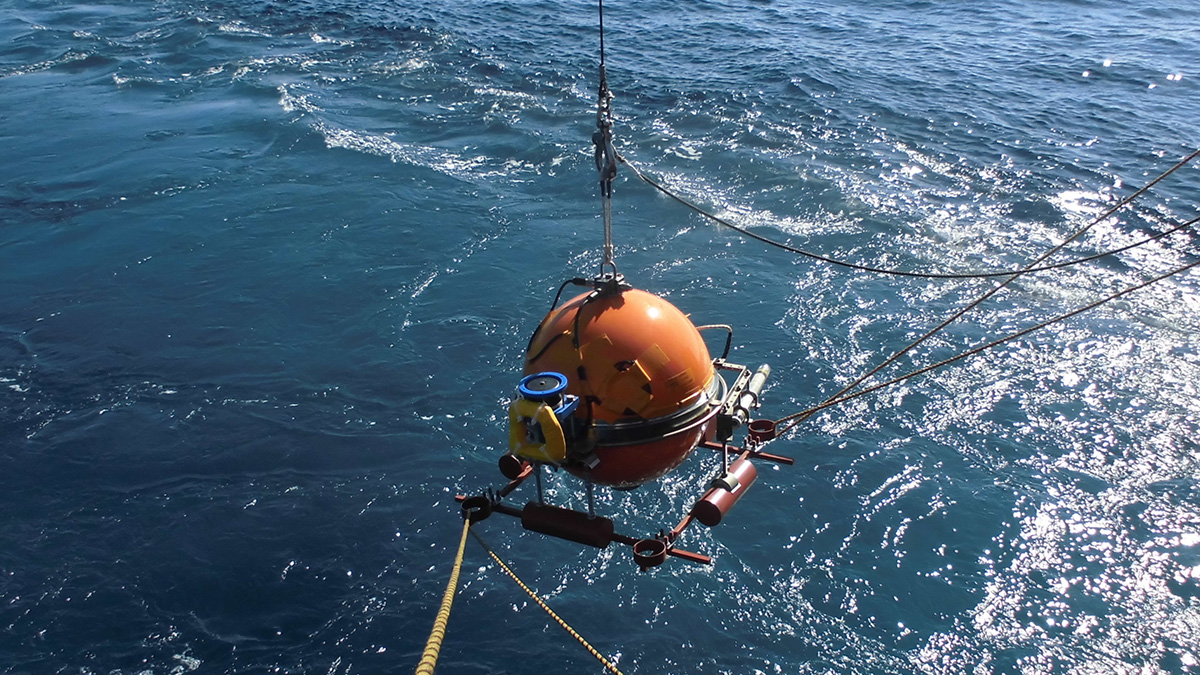
Can Anelastic Attenuation of Oceanic Mantle be Reliably Measured?

by Fan-Chi Lin 26 October 20224 August 2023

A new study demonstrates that robust anelastic attenuation measurements can be made across ocean bottom seismic arrays at different locations using surface wave array analysis.

Three globes showing deep mantle structures in shades of red (hot structures) and blue (cold structures), with shading in each color family indicating depth. The first globe represents the mantle at 200 million years ago. The second shows the mantle at 100 million years ago. The third shows the present-day mantle. Superimposed atop the mantle structures are gray outlines of where a new model shows the continents were at each time. These globes show Asia and Australia on the left and the Pacific Ocean on the right.
Posted inNews

Billion-Year Rewind Tracks Supercontinents and Mantle Structures

by Alka Tripathy-Lang 12 October 20224 August 2023

Scientists have traced past pathways of tectonic plates back a billion years using computer models, with intriguing results. Incorporating geologic data as a check on model output, however, has proven tricky.

A wave washes ashore on a beach in Bali, Indonesia.
Posted inAGU News

Making Waves

by Caryl-Sue Micalizio 26 September 202227 September 2022

Sources of tsunamis are undersea, underground, and under the microscope in our October issue.

Photograph of a Global Seismographic Network station with mountains in the background.
Posted inEditors' Vox

Global Seismic Networks: Recording the Heartbeat of the Earth

by Adam T. Ringler 9 September 20229 September 2022

Global broadband seismographic networks have provided the science community with 30 years of data which is being used to understand the Earth.

Posts pagination

Newer posts 1 2 3 4 5 … 15 Older posts
Over a dark blue-green square appear the words Special Report: The State of the Science 1 Year On.

Features from AGU Publications

Research Spotlights

A Long-Term Look Beneath an Antarctic Ice Shelf

6 March 20269 March 2026
Editors' Highlights

The Fate of the Greenland Ice Sheet: Deep Learning from SkySat Images

9 March 20269 March 2026
Editors' Vox

How Radar Reveals the Hidden Fabric of Ice Sheets

9 March 20269 March 2026
Eos logo at left; AGU logo at right

About Eos
ENGAGE
Awards
Contact

Advertise
Submit
Career Center
Sitemap

© 2026 American Geophysical Union. All rights reserved Powered by Newspack