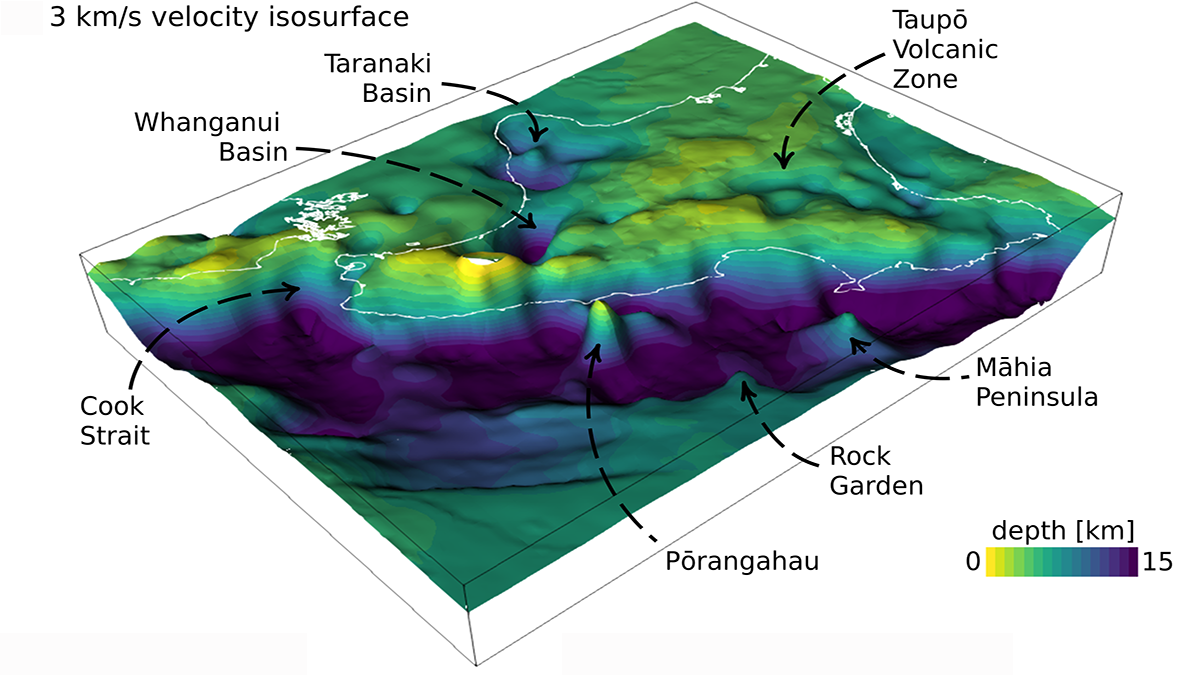
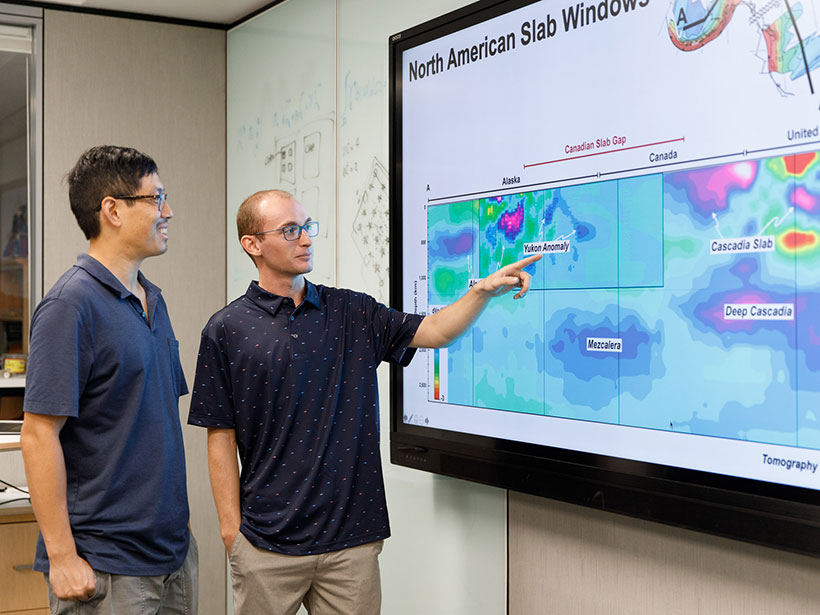
• About
  • Special Reports
  • Topics
    • Climate
    • Earth Science
    • Oceans
    • Space & Planets
    • Health & Ecosystems
    • Culture & Policy
    • Education & Careers
    • Opinions
  • Projects
    • Postcards From the Field
    • ENGAGE
    • Editors’ Highlights
    • Editors’ Vox
    • Eos en Español
    • Eos 简体中文版
    • Print Archive: 2015–2025
  • Policy Tracker
  • Blogs
    • Research & Developments
    • The Landslide Blog
  • Newsletter
  • Submit to Eos
  • AGU.org
  • Career Center
  • Join AGU
  • Give to AGU
  • About
  • Special Reports
  • Topics
    • Climate
    • Earth Science
    • Oceans
    • Space & Planets
    • Health & Ecosystems
    • Culture & Policy
    • Education & Careers
    • Opinions
  • Projects
    • Postcards From the Field
    • ENGAGE
    • Editors’ Highlights
    • Editors’ Vox
    • Eos en Español
    • Eos 简体中文版
    • Print Archive: 2015–2025
  • Policy Tracker
  • Blogs
    • Research & Developments
    • The Landslide Blog
  • Newsletter
  • Submit to Eos
Skip to content
  • AGU.org
  • Career Center
  • Join AGU
  • Give to AGU
Eos

Eos

Science News by AGU

Support Eos
Sign Up for Newsletter
  • About
  • Special Reports
  • Topics
    • Climate
    • Earth Science
    • Oceans
    • Space & Planets
    • Health & Ecosystems
    • Culture & Policy
    • Education & Careers
    • Opinions
  • Projects
    • Postcards From the Field
    • ENGAGE
    • Editors’ Highlights
    • Editors’ Vox
    • Eos en Español
    • Eos 简体中文版
    • Print Archive: 2015–2025
  • Policy Tracker
  • Blogs
    • Research & Developments
    • The Landslide Blog
  • Newsletter
  • Submit to Eos

tomography

Several charts showing the results of hydrothermal flow modelling along a 26 km-long line located on 7-million-year-old Atlantic oceanic crust.
Posted inEditors' Highlights

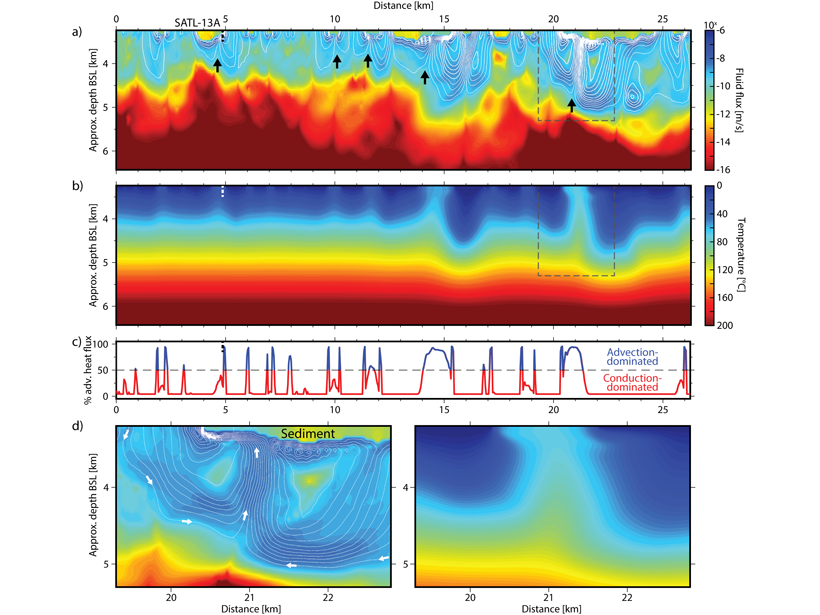
Mechanisms of Hydrothermal Ocean Plate Cooling Revealed

by V. Sallarès 28 September 202127 January 2023

A combination of waveform tomography and hydrothermal modelling allows characterizing the mechanisms and reach of fluid flux and ocean plate cooling near mid-ocean ridges with unprecedented detail.

Diagram showing high velocity slabs in the lower mantle beneath South America's present position and profile showing the westward motion of South America.
Posted inEditors' Highlights

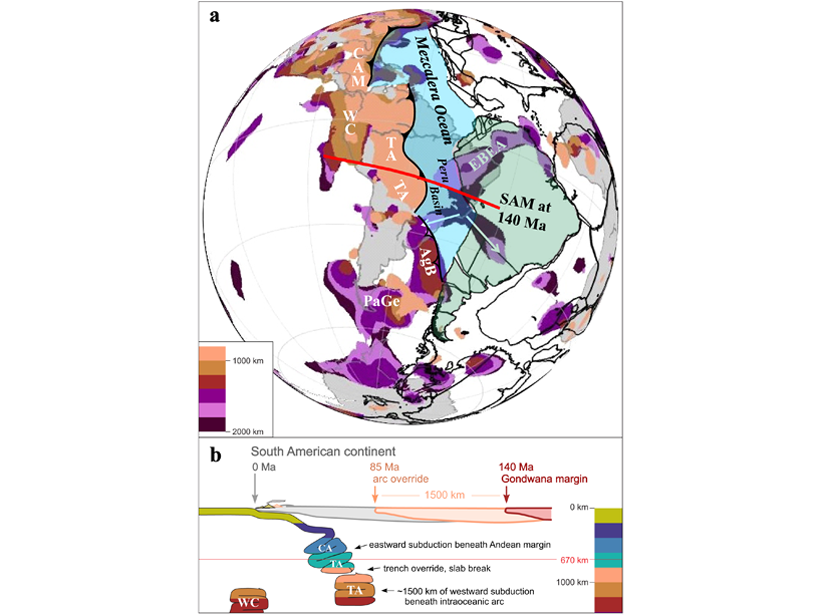
Previous Intra-oceanic Subduction Found Beneath South America?

by M. Assumpção 9 July 202127 January 2023

Newly mapped fast velocity slabs in the lower mantle may be remnants of westward dipping intra-oceanic subduction, before flipping to the present eastward subduction beneath South America at 85 Ma.

3D illustration showing the passive seismic signal recorded at two stations
Posted inEditors' Highlights

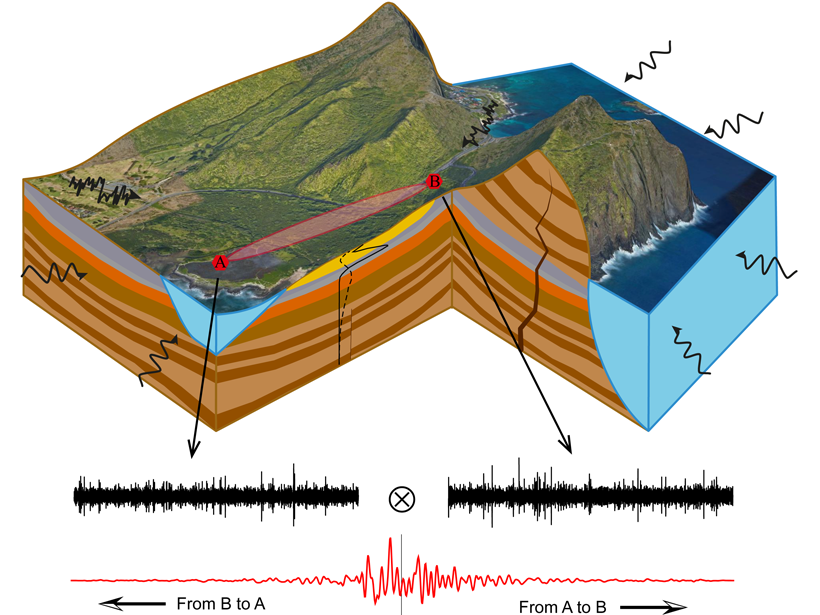
Revealing Complexity of Groundwater Flow with Hydrogeophysics

by A. Binley 29 April 202127 January 2023

A combination of passive seismic and electrical measurements are used to unravel the complex hydrogeology structure and associated groundwater flow paths at a coastal site in O’ahu, Hawai`i.

Xray tomograms taken at two times which show fractures and pores within solid rock.
Posted inEditors' Highlights

When Will the Next Failure Be?

by G. A. Prieto 5 March 202127 January 2023

Unprecedented images of fracture networks in laboratory scale experiments mixed with machine learning algorithms help predict the timing of the next failure.

Cutaway model of Earth’s interior
Posted inNews

Geologists to Shed Light on the Mantle with 3D Model

by E. Gribkoff 4 December 20204 August 2023

The model, which will incorporate 227 million surface wave measurements, could help with everything from earthquake characterization to neutrino geosciences.

Jonny Wu (left) and Spencer Fuston point to a slide displaying mantle tomography in the North Pacific Ocean.
Posted inNews

The Resurrection Plate Is Dead, Long Live the Resurrection Plate

Rachel Fritts, Science Writer by Rachel Fritts 16 November 202027 January 2023

Using a technique similar to taking a CT scan of Earth, researchers found the possible remnants of a long-debated “missing” tectonic plate.

Graphic showing ray-path sampling of Earth by the body-wave constituents of the seismic-event coda-correlation
Posted inEditors' Highlights

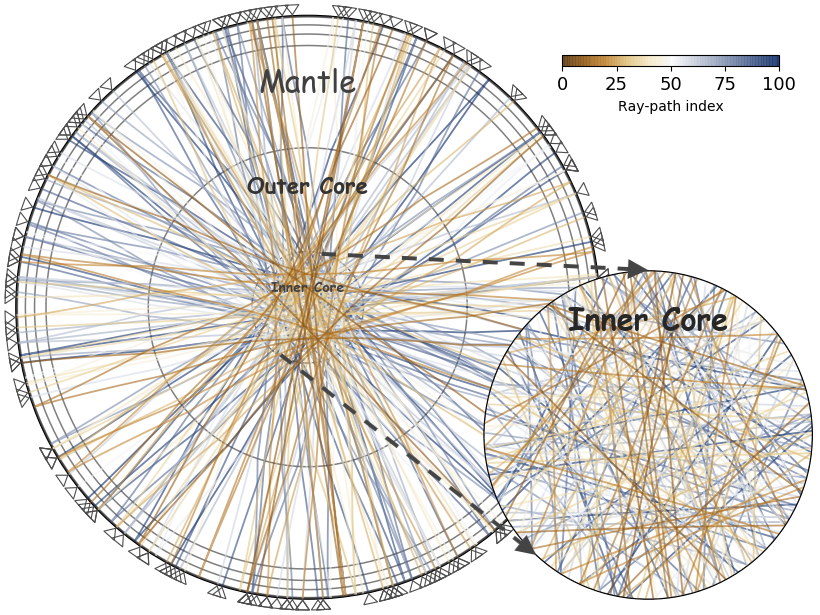
Earthquake-coda Tomography Boosts Illumination of the Deep Earth

by Andreas Fichtner 28 May 202027 January 2023

A new tomographic method based on correlations of seemingly chaotic earthquake coda waves yields otherwise unobservable arrivals, thus greatly improving illumination of the deep Earth.

Graph showing temperatures in four different depth layers over time
Posted inEditors' Highlights

CAT Pictures of Internal Solitary Waves in Indonesian Strait

by J. Sprintall 7 October 201927 January 2023

Huge and rapid subsurface temperature changes associated with propagating internal solitary waves were observed from a moored coastal acoustic tomography (CAT) system in Lombok Strait in Indonesia.

Photo of twelve gold grains used in this study
Posted inEditors' Highlights

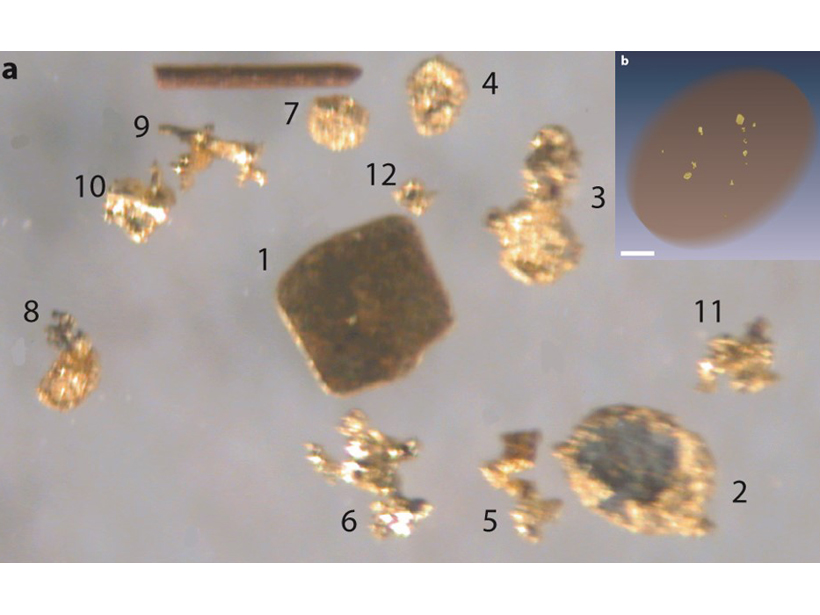
X-Ray Computed Tomography Detects Resolution Scale Gold Grains

by A. Revil 2 May 201928 February 2023

A method combining partial-volume and blurring effects can be used to measure small features in computed tomography data volumes.

Seismic tomography imaging shows a portion of a “blob” that sits at the base of the mantle below Africa.
Posted inFeatures

The Unsolved Mystery of the Earth Blobs

Jenessa Duncombe, Staff Writer by Jenessa Duncombe 27 February 201927 January 2023

Researchers peering into Earth’s interior found two continent-sized structures that upend our picture of the mantle. What could their existence mean for us back on Earth’s surface?

Posts pagination

Newer posts 1 2 3 Older posts
Over a dark blue-green square appear the words Special Report: The State of the Science 1 Year On.

Features from AGU Publications

Research Spotlights

As Wildfires Increase in the West, So Does Suppression Spending

10 June 202610 June 2026
Editors' Highlights

Pre-Existing Structure and Stress Shape Geothermal-Induced Seismicity

2 June 20261 June 2026
Editors' Vox

Small-Scale Indian Ocean Dynamics Underpin Marine Ecology and Climate

4 June 20263 June 2026
Eos logo at left; AGU logo at right

About Eos
ENGAGE
Awards
Contact

Advertise
Submit
Career Center
Sitemap

© 2026 American Geophysical Union. All rights reserved Powered by Newspack