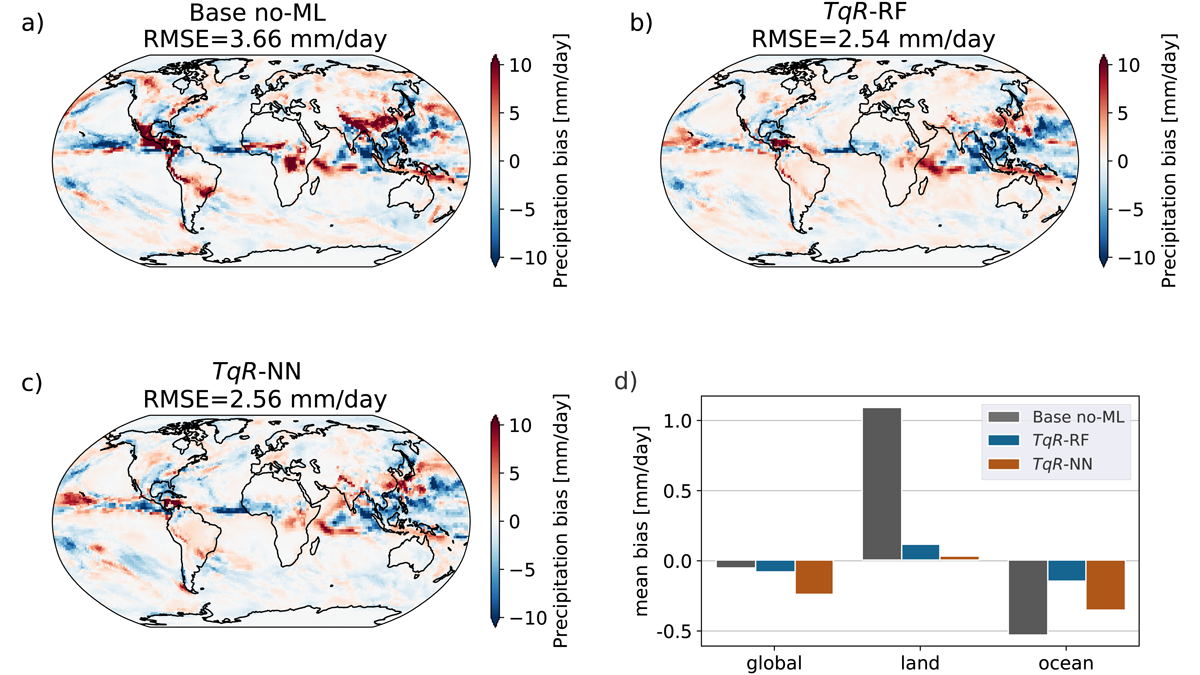
A machine-learned correction enables an efficient coarse-grid global atmosphere model to better track the weather and time-mean precipitation of an expensive fine-grid ‘digital twin’ reference model.
Editors’ Highlights
Posted inEditors' Highlights
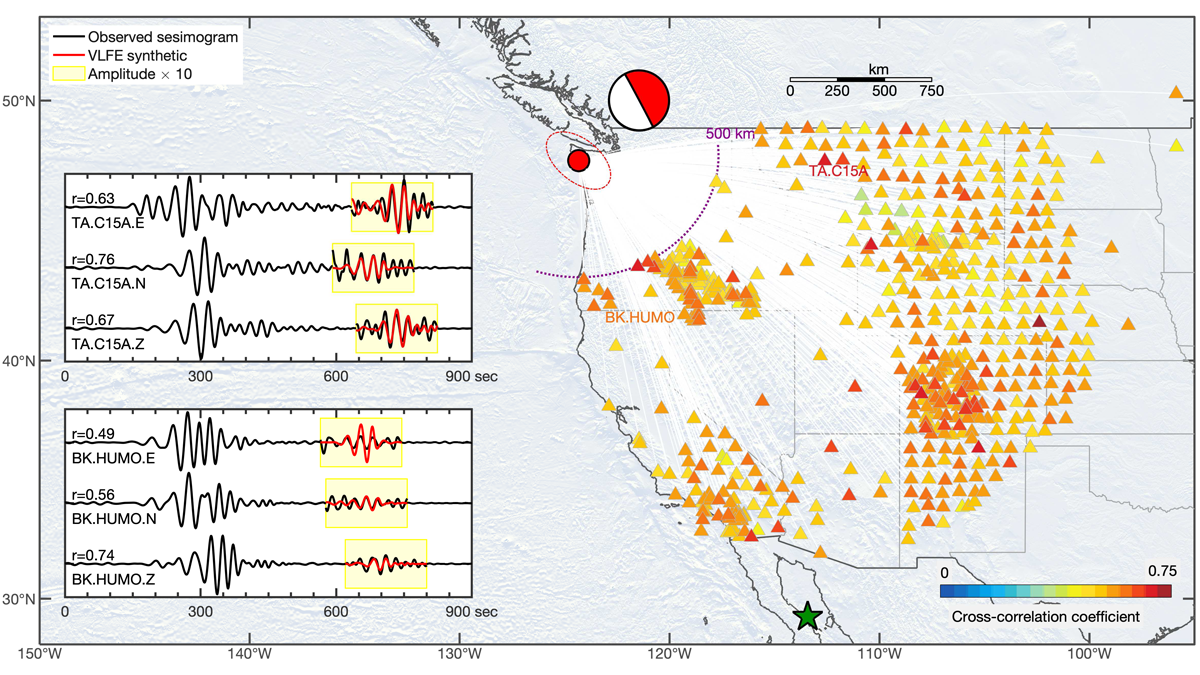
Continent-Scale Detection of Triggered Low Frequency Earthquakes
Very low frequency events in the gap zone of Cascadia illustrate how stress evolves on megathrusts, advancing our understanding of rupture dynamics.
Posted inEditors' Highlights
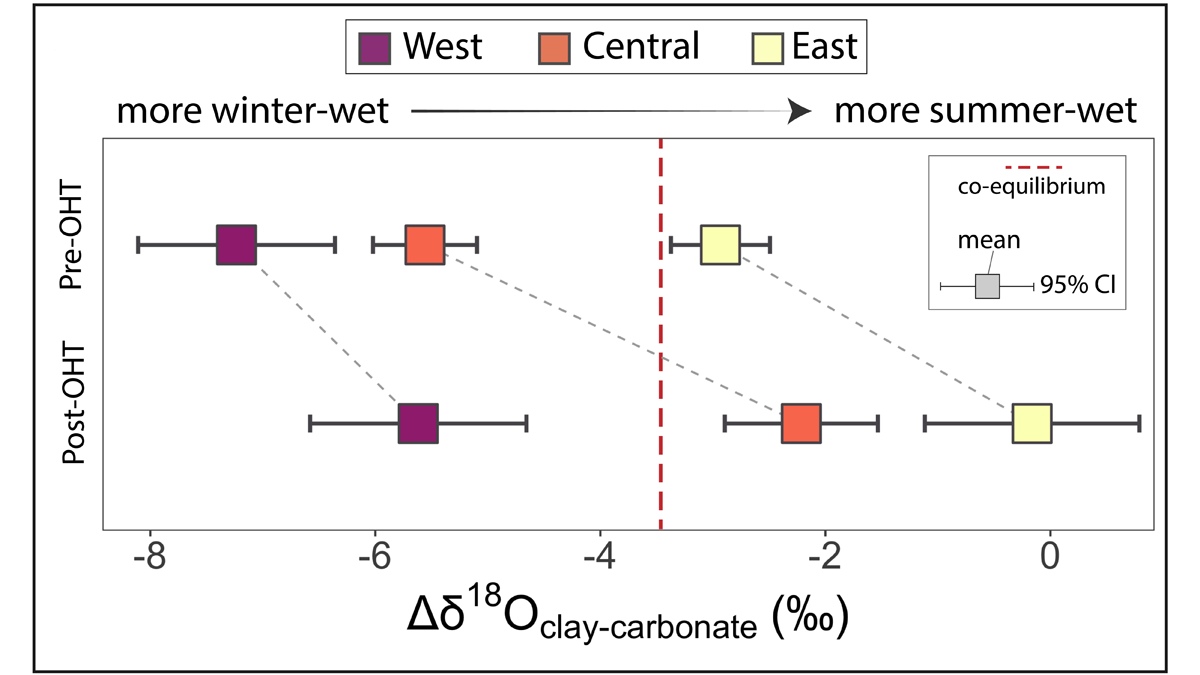
What Caused the Open Habitat Transition in the West-Central U.S.?
Between 26-15 My ago, forests covering west-central North America gave way to open, grassy habitats. Now, oxygen isotope records suggest this shift is owed to drier winters and increased aridity.

Posted inEditors' Highlights
Air Pollution Was Reduced During the COVID-19 Pandemic
A decrease in emissions of ozone precursor gases during the COVID-19 economic downturn likely explains the unusual reduction in ozone concentrations observed during the spring and summer of 2020.

Posted inEditors' Highlights
Reef-Building Corals at Risk from Ocean Warming, Acidification
Physiological limitations on regulating internal chemistry restricts corals’ ability to deal with ocean acidification and warming, thereby reducing resilience to continued environmental change.
Posted inEditors' Highlights
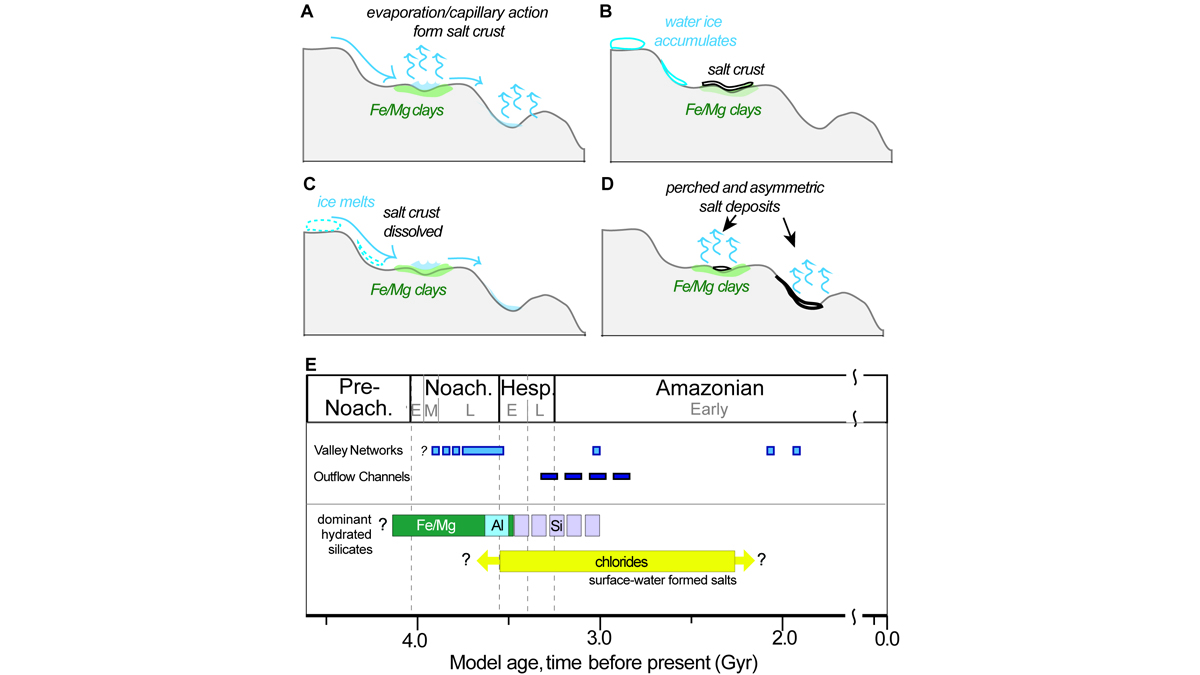
Young Ponds on Mars
A detailed study of evaporite (chloride) deposits on Mars shows that small bodies of surface water persisted until about 2.5 Ga, more recently than previously thought.
Posted inEditors' Highlights
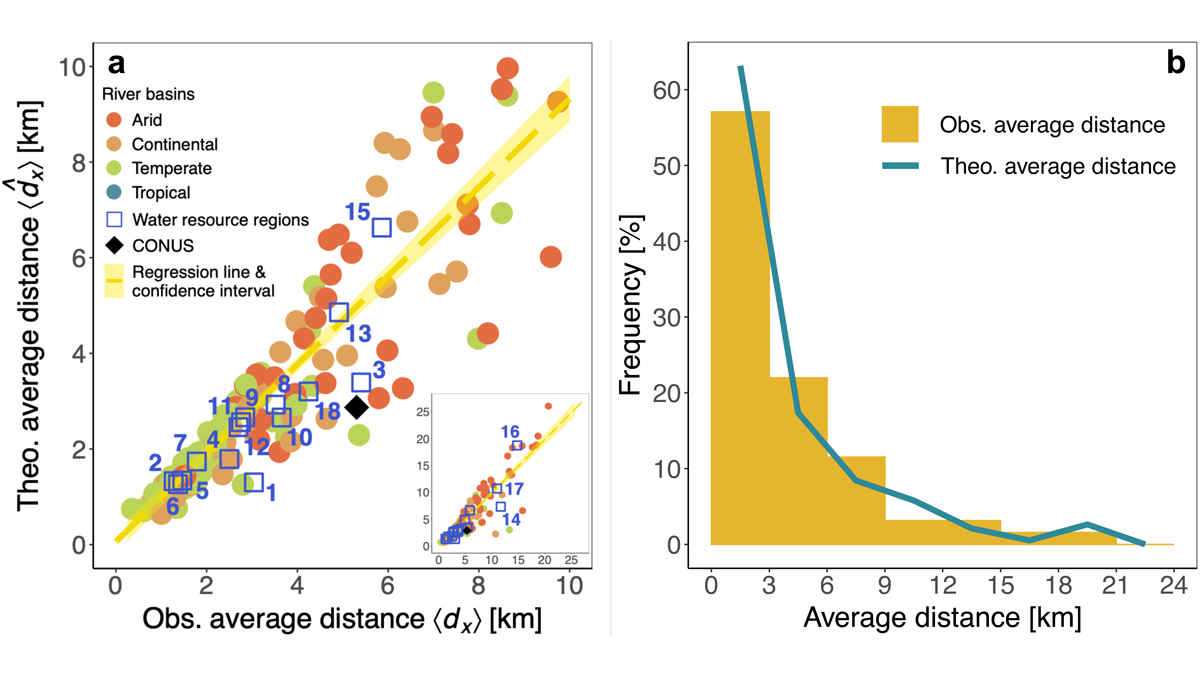
Urbanization and Surface Water Loss Go Together
Mapping surface water loss from satellite data confirms decreases away from urban areas. A simple exponential distance-decay model approximates the impact of urbanization.
Posted inEditors' Highlights
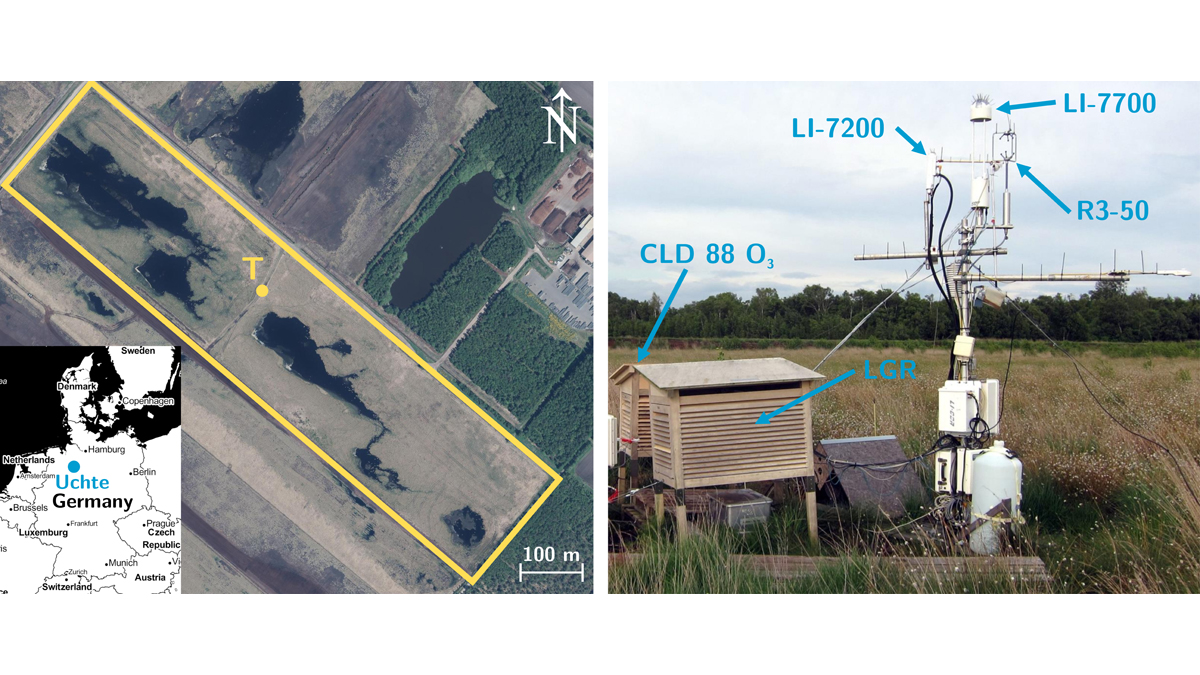
Being Cool is a Slow Ride When You’re a Restored Wetland
Restoring formerly drained peat wetlands can mitigate climate-warming emissions but the reward takes patience.
Posted inEditors' Highlights
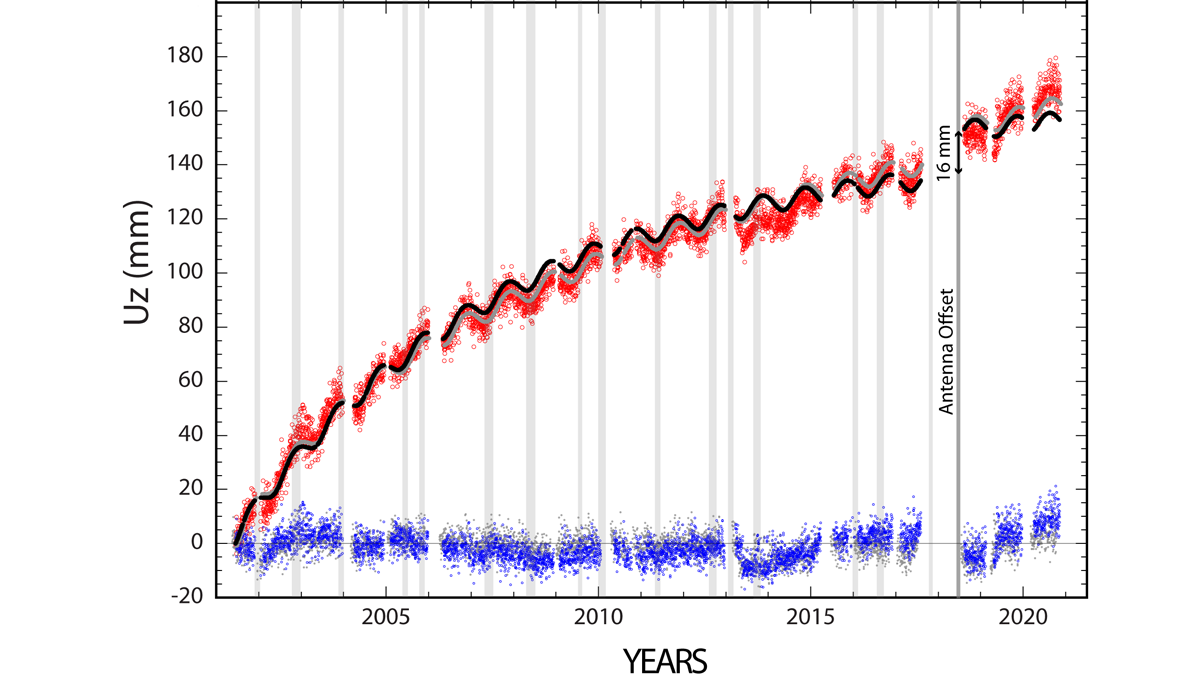
Continuity is the Father of Success
Geodetic measurements indicate that Three Sisters Volcano uplifted by almost 300 millimeters in the past 25 years without significant anomalies at the surface.

Posted inEditors' Highlights
Clay Type, Not Just Content, Crucial for Fault Zone Permeability
Faults containing clays are often considered as barriers to fluid flow but new work shows that fault processes leading to the formation of clays can increase permeability relative to the host rock.