
A translation of this article was made possible by a partnership with Planeteando. Una traducción de este artículo fue posible gracias a una asociación con Planeteando.
Three space agencies have released a database to help the public and policy makers trace the worldwide impact of the coronavirus. NASA, the European Space Agency (ESA), and the Japan Aerospace Exploration Agency (JAXA) have collaborated to provide an online portal with regularly updated metrics.
The satellite data “tell the story of what’s happening on the Earth right now,” said Thomas Zurbuchen, the associate administrator of NASA’s Science Mission Directorate.
At least 17 satellites are being actively used in the dashboard, and others will join in the future.
But the changes may be short-lived. “I do see an immediate increase” in nitrogen dioxide, one of the atmospheric compounds monitored by the satellites, as cars return to the road and industry picks up again, said Josef Aschbacher, the director of ESA Earth Observation Programmes. Such activity is “very important and required for the economy to come back on its feet.”
Here are six trends we can already see from above.
1. The Asparagus Crop Dropped by 30% in Germany
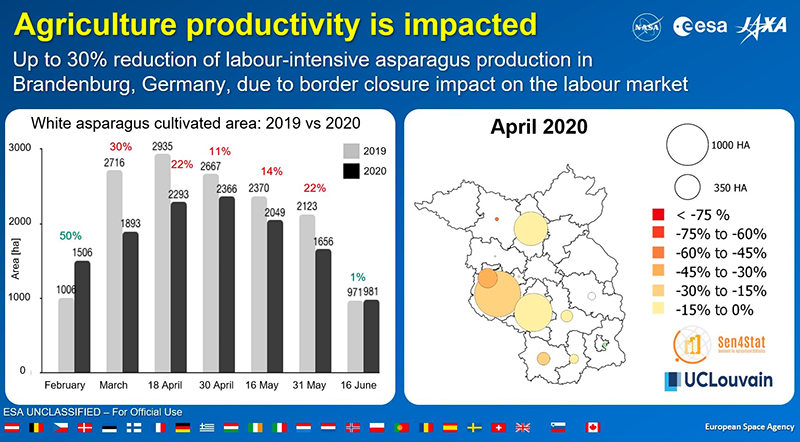
Scientists monitored the cultivated area for asparagus in the German state of Brandenburg this year and compared it with that for 2019. The amount of cultivated area was down 20%–30% in March and April, according to data from satellites.
The German agricultural ministry estimated a loss of 300,000 workers for this year’s crops.
“Organizations like the Food and Agriculture Organization and the World Food Program expressed their concerns that the COVID-19 outbreak might turn from a health crisis to global food crisis,” said Anca Anghelea, a scientist at ESA.
Seasonal workers couldn’t move as easily during the COVID-19 lockdowns, and the German agricultural ministry estimated a loss of 300,000 workers for this year’s crops. Usually, workers travel from Bulgaria and Romania to Germany for the harvest between March and June. But governments severely restricted travel this year to stymie the virus outbreak.
Asparagus is highly labor intensive, said Anghelea, so harvesting couldn’t continue as normal. The German Farmers Association estimates the harvest will be down by about a quarter this year.
Elsewhere, food sits idle in “potato mountains,” according to the BBC.
2. Light Pollution Intensified at a Medical Center in San Francisco
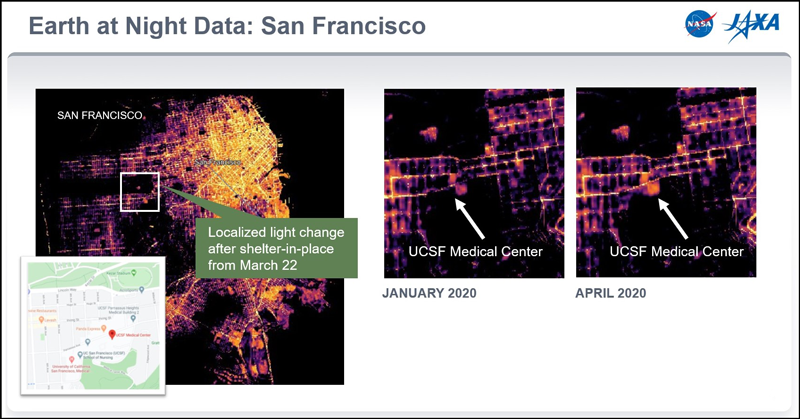
Nighttime light from the medical center at the University of California, San Francisco, shone brighter in April than in January, according to light intensity data from a NASA and National Oceanic and Atmospheric Administration satellite. The city reached its peak daily cases of COVID-19 in April.
The central business districts of San Francisco shone less bright during the lockdowns.
Scientists analyzed the amount of light pollution in populated areas by measuring total light intensity and removing natural sources like moonlight. The results show the effects of strict lockdowns on population centers.
The central business districts of San Francisco dimmed during the lockdowns, as the area’s 6.7 million residents stayed home. The trend is also noticeable in market areas and entertainment districts.
3. Beijing Factories Made Fewer Cars, and Singapore Patient Parking Rose
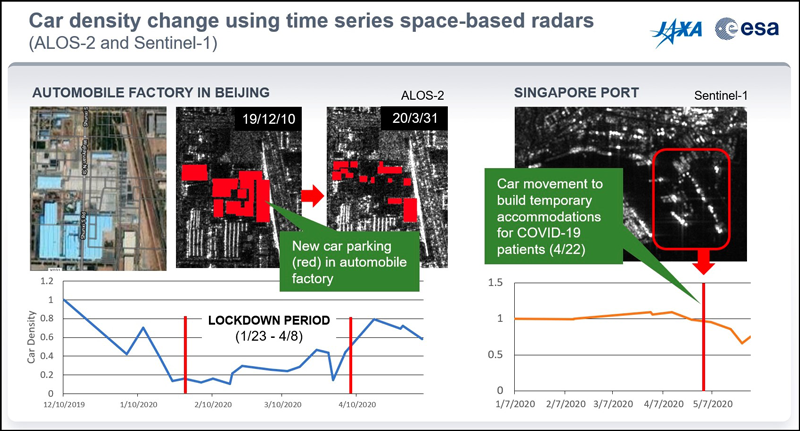
Car production screeched to a halt at one Beijing factory analyzed by JAXA’s ALOS-2 satellite and the European Sentinel-1. Researchers compared car density outside the factory and found that density hovered between about 20% and 40% during the lockdown. Since restrictions have lifted in China, car density has rebounded.
Meanwhile, Singapore shepherded cars of COVID-19 patients for temporary parking at a designated port. Satellite data reveal how car movement increased slightly during the beginning of the outbreak and has decreased since the end of April.
4. Nitrogen Dioxide Slashed by Half in Europe

Air in Europe had less nitrogen dioxide (NO2) during the lockdowns from cars, trucks, and power plants burning less fossil fuels. The pollutant lasts for only a matter of hours in the lower atmosphere, said NASA scientist Ken Jucks, so it is especially responsive to short-term changes.
NO2 values dropped by 50% in Madrid, Milan, Rome, and Paris compared to last year.
In other parts of the world, the United States saw dips of 30% from Washington, D.C., to Boston, and concentrations in New Delhi and Mumbai, India, halved.
Data came from the Copernicus Sentinel-5P satellite from ESA, which uses the Tropospheric Monitoring Instrument (TROPOMI) to watch for methane, carbon monoxide, nitrogen dioxide, ozone, and other atmospheric components in the troposphere.
5. Shipping Ports in New York Sat Empty
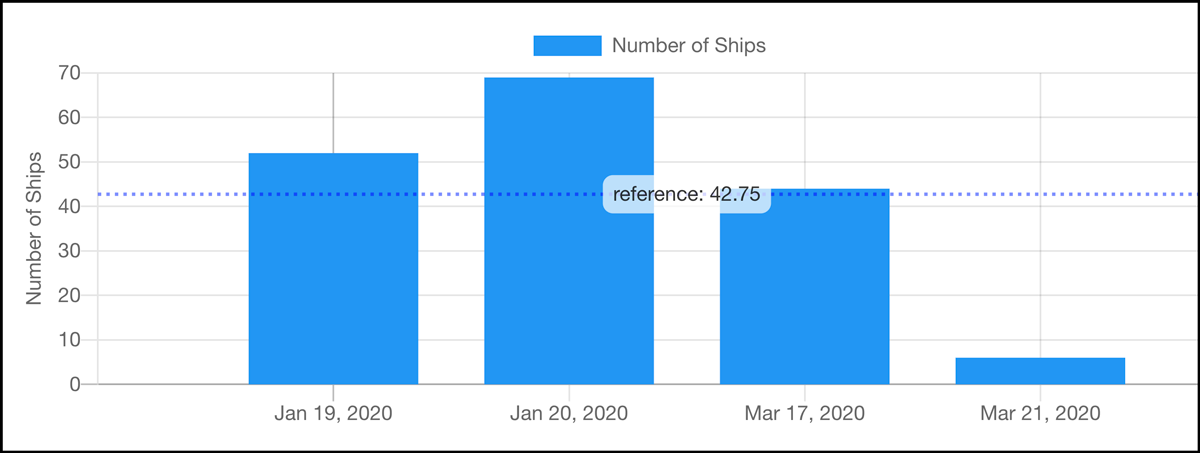
NASA employed an artificial intelligence (AI) algorithm to detect shipping activity from satellite images at several major ports in the United States. Travel restrictions have crippled supply chains around the world.
In New York, only 6 ships sat in the ports on 21 March, compared with 69 two months before.
Human eyes double-check the AI output before the data go to the dashboard. Scientists hope that monitoring may reveal trends in pollutants from global shipping, which is a large contributor of global fossil fuel emissions.
6. Carbon Dioxide in Beijing Fell, Then Boomeranged Back
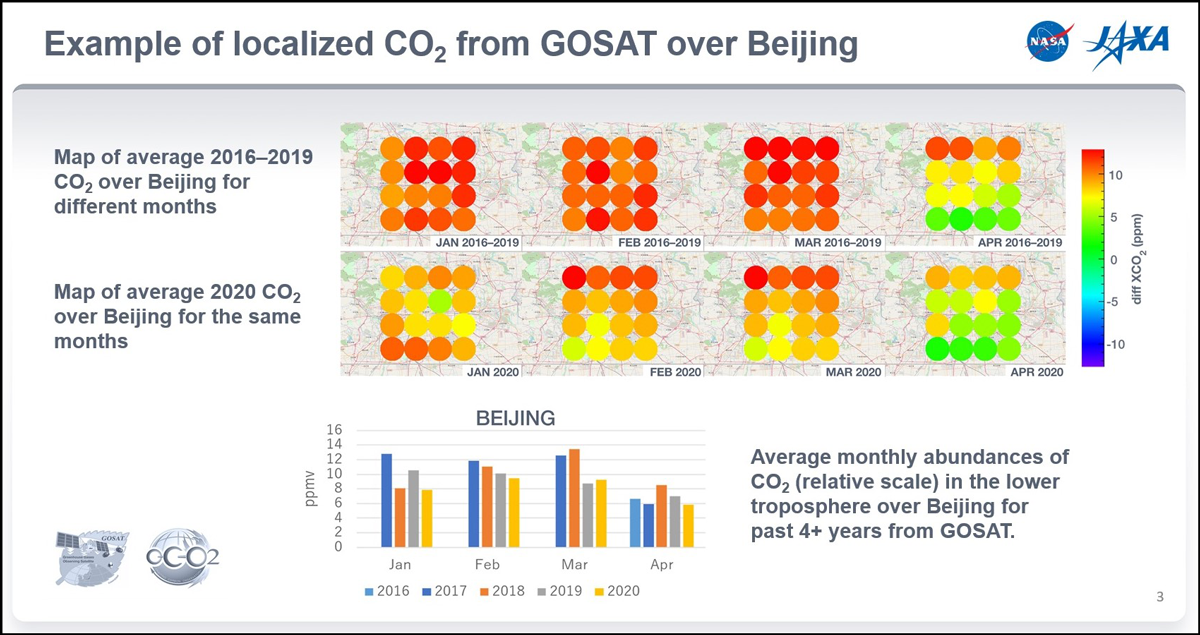
Carbon dioxide (CO2) stays in the atmosphere much longer than NO2, said Jucks. “Instead of a lifetime of a few hours, it has a lifetime that will be centuries.”
For this reason, it is difficult for researchers to suss out the relatively small variations in carbon dioxide because the reservoir in the atmosphere is so much larger than that of NO2.
The drop in CO2 from lockdowns is “a blip.”
But they did detect a drop “anywhere from 5%–30% over a few months,” said Jucks.
NOAA recorded its highest CO2 levels in May. The drop in CO2 from lockdowns is “a blip,” added Jucks, and CO2 levels are now returning to normal.
To limit warming, “we’re going to need to reduce our CO2 emissions from the current levels by significant amounts, probably 50% or more in order to get to those goals right now.”
“We need to figure out as a species how to change how we operate.”
—Jenessa Duncombe (@jrdscience), Staff Writer
This news article is included in our ENGAGE resource for educators seeking science news for their classroom lessons. Browse all ENGAGE articles, and share with your fellow educators how you integrated the article into an activity in the comments section below.
Citation:
Duncombe, J. (2020), Six ways satellites tracked COVID-19, Eos, 101, https://doi.org/10.1029/2020EO146340. Published on 26 June 2020.
Text © 2020. AGU. CC BY-NC-ND 3.0
Except where otherwise noted, images are subject to copyright. Any reuse without express permission from the copyright owner is prohibited.