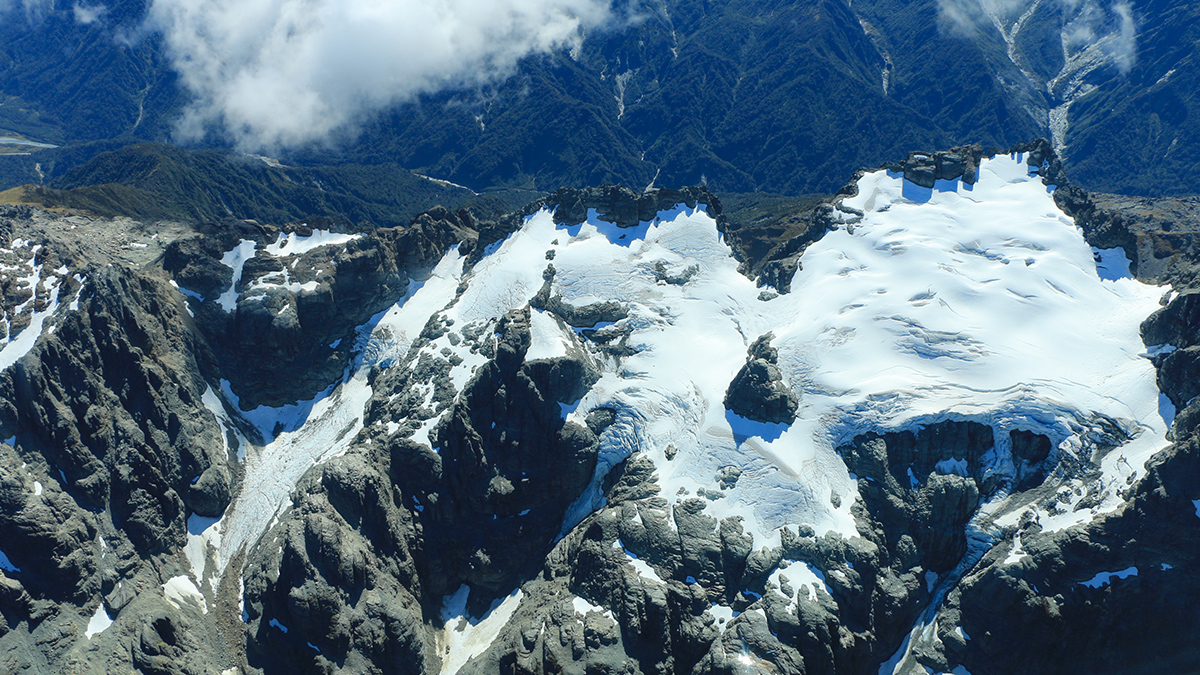
Each year in early March, when summer turns to fall in the Southern Hemisphere, New Zealand glaciologists gather at an airfield in Queenstown to embark on a predawn flight along the spine of the Southern Alps.
For hours, they twist in the Cessna’s narrow seats to train cameras on glaciers clinging to mountaintops. The images capture the glaciers’ vanishing contours and the shifting snowline—the demarcation between the remains of the winter snowpack and exposed glacial ice.
“It’s like a bank account,” said Andrew Lorrey, a climate scientist at the National Institute of Water and Atmospheric Research who has been coordinating the surveys for 16 years. “If we put in the same amount of snow in winter as we’re taking out in summer, the glacier would be in balance, melting at its terminus but advancing downhill due to gravity and replenishing the ice that’s lost.”
But the surveys, which have been running since 1977, show that summer melt now far exceeds winter snowfall and “we’re seeing the glaciers’ terminus and sides, the whole body, diminishing.”
New Zealand has lost more than a third of its glacial ice and the archipelago ranks third globally—after central Europe and the Caucasus—in the proportion of ice lost to rising temperatures, according to findings published in Nature by the first comprehensive global Glacier Mass Balance Intercomparison Exercise (GlaMBIE).
Global Assessment of Glacial Retreat
The project assessed observations from 35 international teams, with a goal of reconciling all methods used to track glacial mass changes. These methodologies range from in situ measurements (in which scientists stud individual glaciers with ablation stakes to record their shrinkage) to various satellite-borne sensors (which use optical, radar, laser, and gravimetry technologies to track changes in glacial surface elevation).
Bringing all these methodologies together, the GlaMBIE team produced a time series of global glacial mass change between 2000 and 2023, showing that collectively, the world’s glaciers lost 5% of their total volume. “This may not seem much,” said Michael Zemp, GlaMBIE project leader and director of the World Glacier Monitoring Service at the University of Zürich. But it means an annual global loss of 273 billion tonnes (301 billion tons) of ice.
“The ice lost each year amounts to the water intake of the entire global population in 30 years.”
“To put this in perspective,” Zemp said, “the ice lost each year amounts to the water intake of the entire global population in 30 years, assuming 3 liters per person a day.”
Andrew Shepherd, an Earth scientist at Northumbria University who was not involved in this project but has led a similar assessment of mass loss from polar ice sheets, welcomed the authoritative standardized framework provided by GlaMBIE.
Reconciling the different methodologies is important because “climate change isn’t smooth,” Shepherd said. Short-term in situ measurements can deliver contrasting results and each satellite technique has its strengths and weaknesses, but “bringing all methods together leads to a clearer picture of total ice loss,” he noted.
Although all areas experienced ice loss, the GlaMBIE results show significant differences between regions, ranging from 1.5% ice loss in the Antarctic to 39% in central Europe.
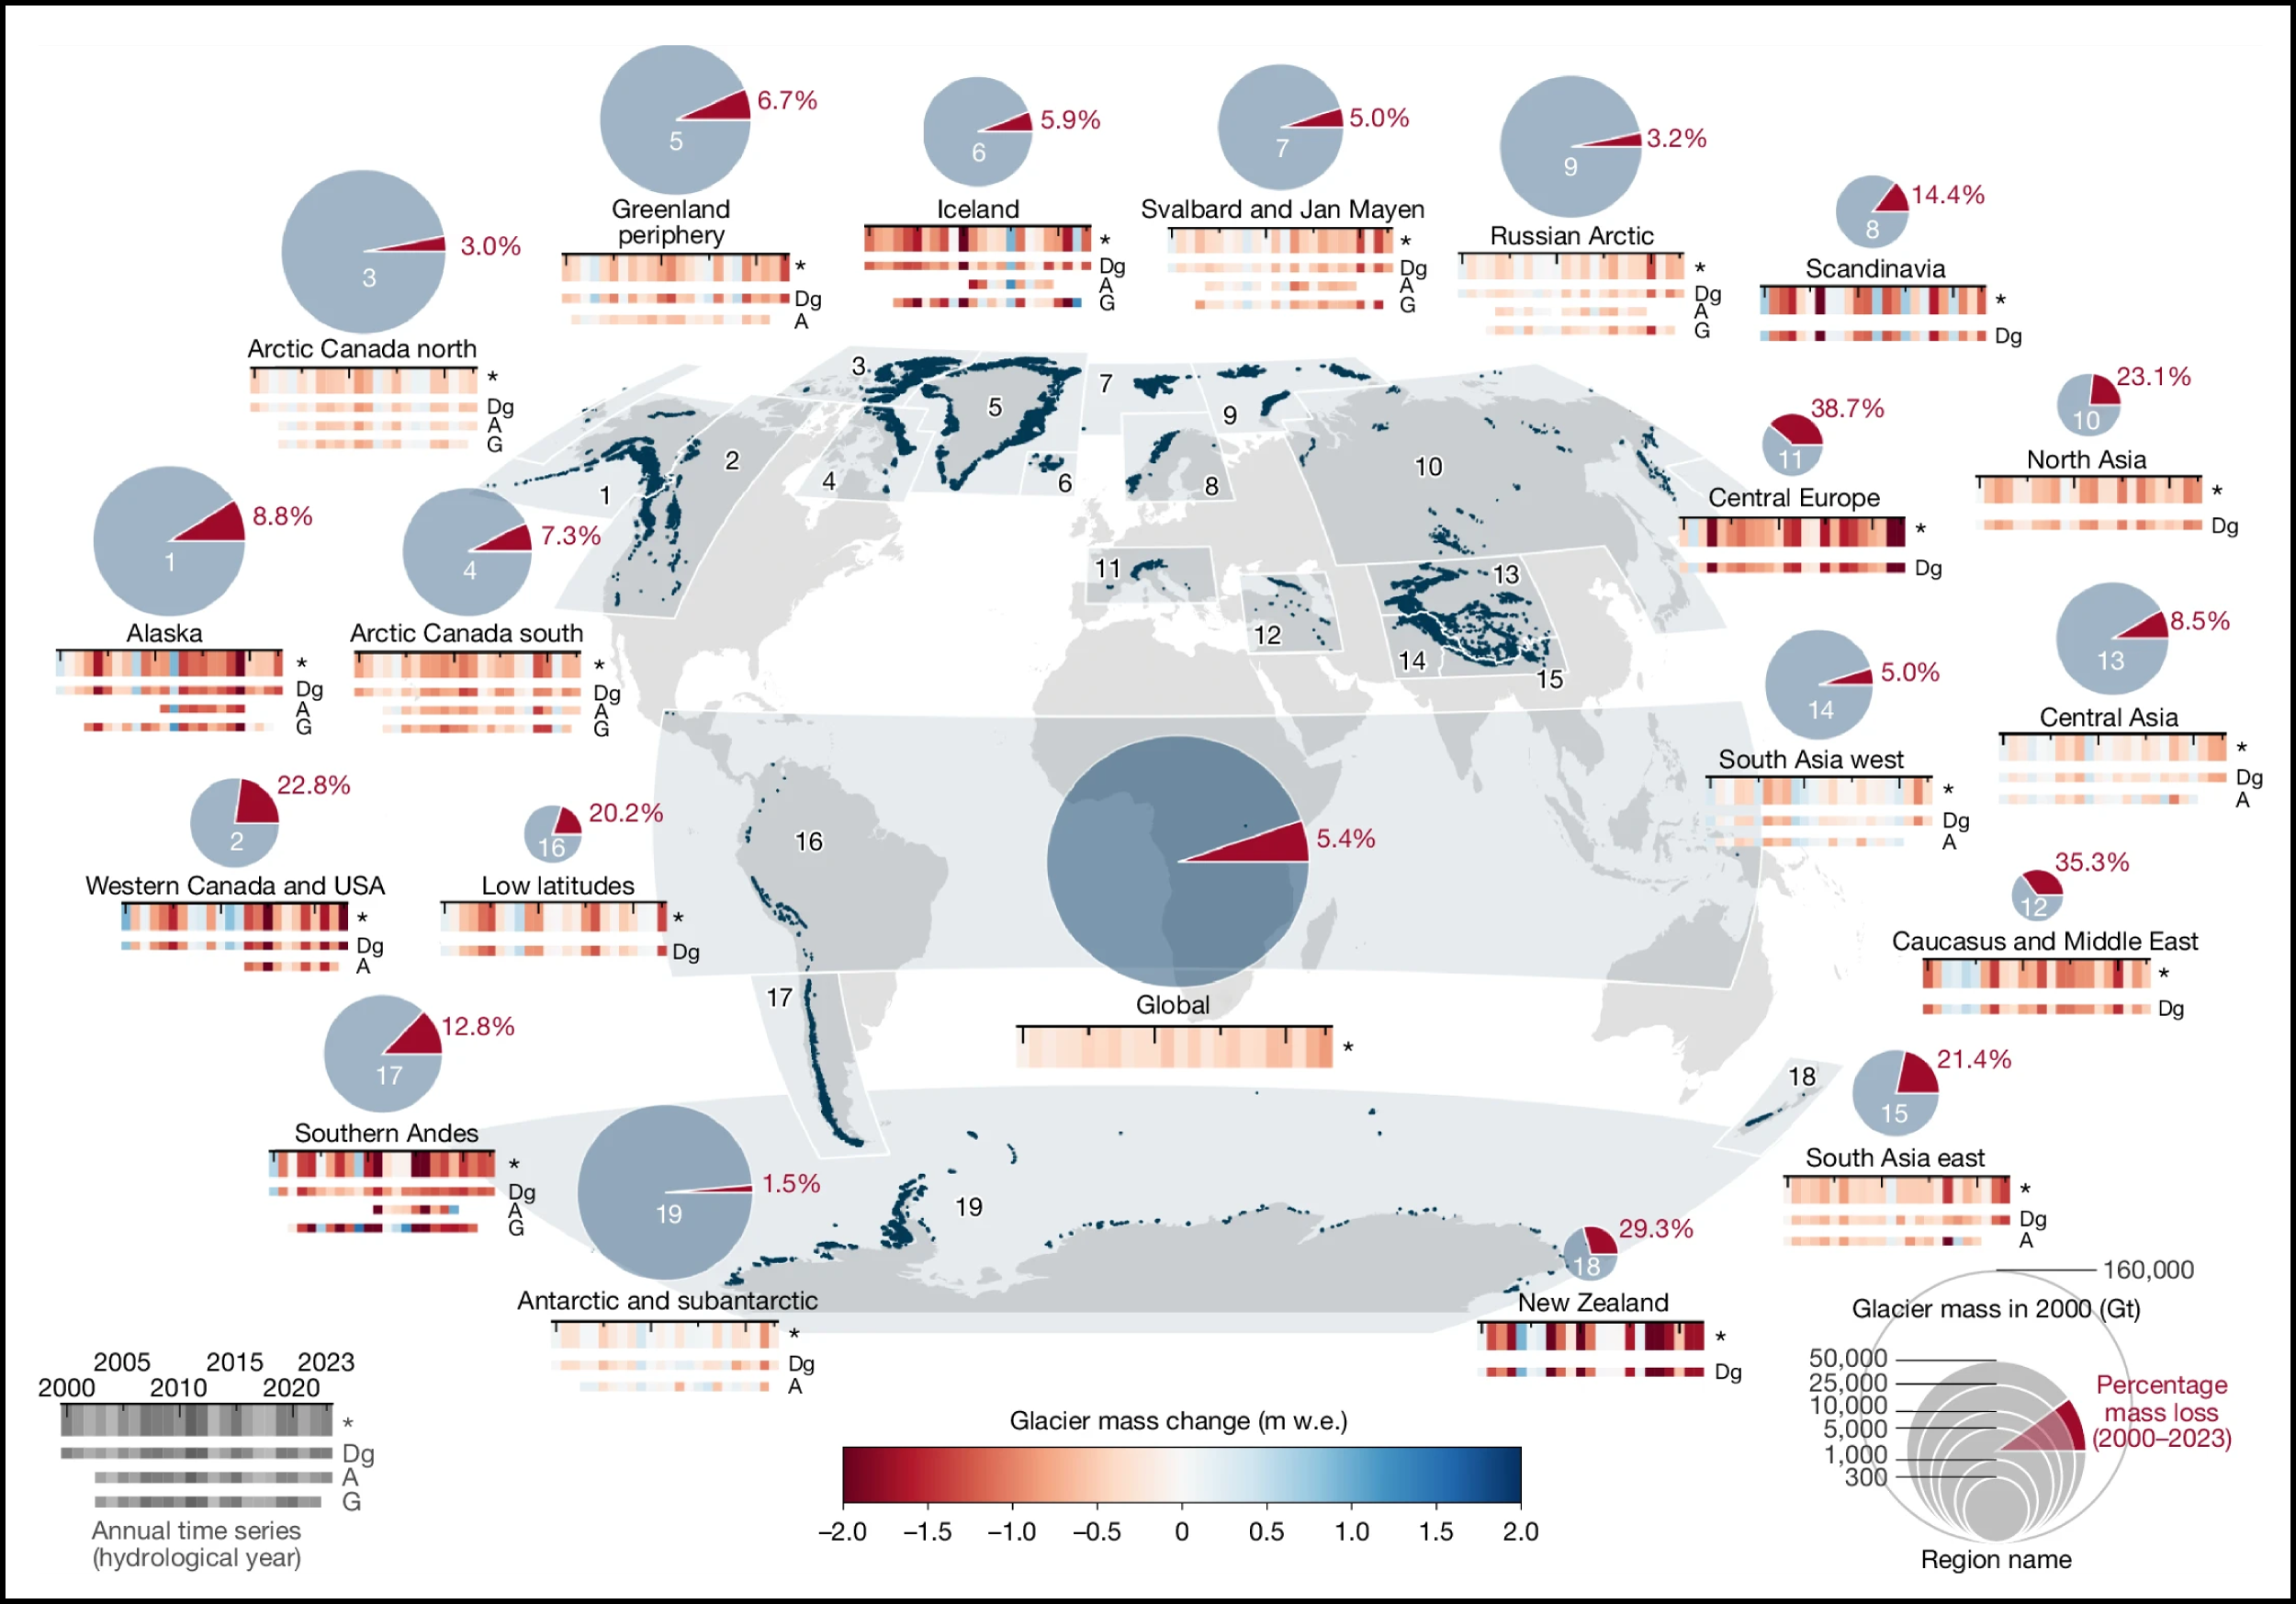
The largest overall contribution to ice loss (22%) comes from Alaska, said Caitlyn Florentine, a research physical scientist with the U.S. Geological Survey in Bozeman, Mont., and a GlaMBIE member.
Alaska, like the Canadian Arctic and Greenland, has enormous volumes of ice. But the relatively low elevation and latitude of Alaskan glaciers meant that these ice fields “were the biggest contributor to sea level rise [from glaciers] in the first 2 decades of this century and are projected to continue [to be] until 2100,” Florentine explained.
“Every centimeter of sea level rise exposes another 2 million people to annual flooding somewhere on our planet.”
The GlaMBIE results also revealed clear evidence of increasing melt rates, with a 36% jump during the second half of the study period, from 2012 to 2023. Mountain glaciers hold enough water to raise sea level by 32 centimeters if all were to melt. The ice that has already been lost from the world’s mountains has contributed 18% more to sea level rise than the loss from the Greenland Ice Sheet and more than twice the loss from the Antarctic Ice Sheet.
“Even small amounts of sea level rise matter, because it leads to more frequent coastal flooding,” Shepherd said. “Every centimeter of sea level rise exposes another 2 million people to annual flooding somewhere on our planet.”
Zemp hopes to focus future work on assessing how glacier melt affects seasonal runoff, and that requires ongoing access to satellite data and higher-resolution remote sensing techniques. As some satellites and sensors approach the end of their missions, he’s concerned about continuing the study. “If we are left without open access to high-resolution stereo imaging missions with a global coverage, we’d be blind to these changes,” he said.
Gone This Century
In addition to the ice sheets in Antarctica and Greenland, there are more than 275,000 glaciers—or crystal cones, as Zemp calls them—in mountain ranges from the tropics to the polar regions. Only about 500 are monitored up close.
One is Brewster Glacier in New Zealand, which Te Herenga Waka–Victoria University of Wellington glaciologist Lauren Vargo visits regularly. She drills ablation stakes into the ice in spring and retrieves their exposed parts in fall. In the 8 years between 2016 and 2024, she’s helped document that the glacier has shrunk by 24% and lost 17 meters in height.
The retreat made Vargo’s latest visit, in March, physically taxing, she said. “The more melt that happens, the more stakes you have to collect,” she explained. “I don’t think I could have carried any more stakes.”
Many glaciers will not survive this century, Zemp said. Among these is one of his favorites, Oberaargletscher at Grimselpass in Switzerland, which Zemp has studied for almost a quarter of a century and, more recently, began visiting with his sons.
Oberaargletscher will be gone by 2050, regardless of any cuts to carbon emissions, Zemp said. While the retreat is “interesting to witness as a scientist,” he continued, “I am deeply sad that my sons and their generation will lose this fantastic glacier.”
—Veronika Meduna (@veronikameduna.bsky.social), Science Writer