Spending a day on the shores of the Pacific Ocean means traveling past at least one blue, rectangular-shaped warning sign: tsunami hazard zone. The sign warns that if the earth rumbles, the sea suddenly retreats from the beach, or strange noises come from the ocean, beachgoers should hustle for higher ground.
Tsunami risk areas are usually determined on the basis of estimates of how big local tsunamis were in the past. But understanding the reach of ancient tsunamis—how big, how fast, and how far inland—can be tricky.
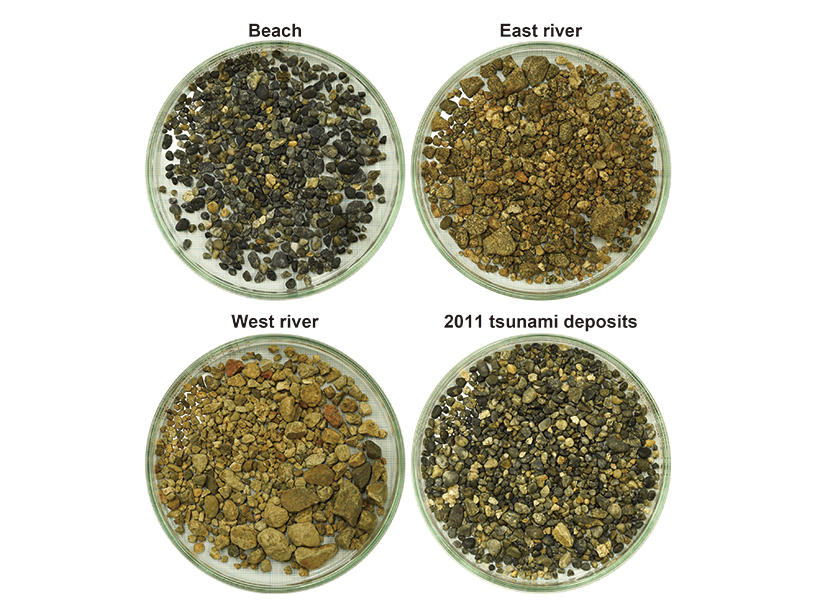
In a new paper in Scientific Reports, researchers reconstructed the characteristics of past tsunamis using gravel. Specifically, scientists looked at how round the sediment was in paleotsunami deposits to infer how far inland the wave reached. They then used that inundation level to estimate the size of ancient tsunamis.
Tsunami Deposits
The study site—Koyadori, a V-shaped valley along the Sanriku coast in eastern Japan—experienced a tsunami wave run-up during the 2011 Tohoku earthquake event. In addition to the modern event, Koyadori has historical records of past tsunamis spanning 400 years.
The team looked at sediments in trenches, outcrops, and drilling cores to identify tsunami deposits. The team ultimately collected gravel from 164 tsunami deposits at 56 sites in the valley.
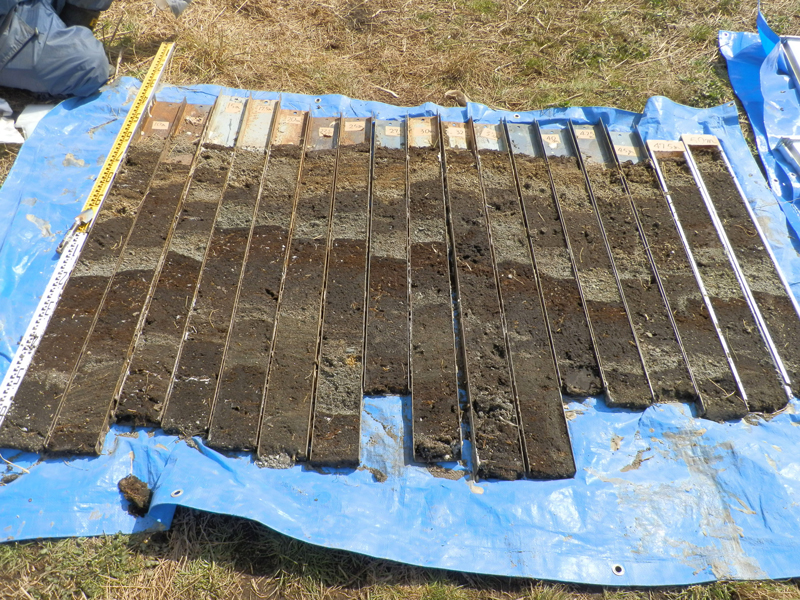
“Event deposits are distinguishable layers within normal sediments,” said Daisuke Ishimura, an author on the study and an assistant professor at Tokyo Metropolitan University. He added that the sediment structures, macro- and microfossils, and mineralogy helped the team distinguish paleotsunami deposits from storms and high tides.
But it’s not just geological evidence that pointed the researchers to tsunami deposits.
“The local resident interviews were also useful,” said Ishimura. “They told me inundation history at Koyadori during the [most] recent 50 years.” Ishimura added that the eyewitness reports also helped his team confirm whether the deposits were a result of a storm or high tide versus a tsunami.
Clues in the Gravel
Instead of eyeballing how round the sediment was, the team used machine-led image analysis.
After collecting and identifying tsunami deposits, the team examined their shape. “Each of the source sediments at Koyadori has a unique distribution of gravel roundness,” said Ishimura.
Instead of eyeballing how round the sediment was, the team used image analysis. This machine-led task gave the team “10 to 100 times more data than existing, manual methods,” said Ishimura. “Therefore, we could statistically calculate the mixture ratio of fluvial and beach sediments.”
Ishimura said because they had recorded inundation distances from three modern and historical tsunami deposits, researchers could normalize each sample distance from the coastline.
In each paleotsunami deposit, “we found a common, abrupt change in the ratio of beach sediments to fluvial sediments at approximately 40% of the inundation distance from the coastline, regardless of tsunami magnitude,” said Ishimura. They named this change in ratio the tsunami gravel inflection point (TGIP). Ishimura said that by using TGIP, he and his colleague were able to estimate paleotsunami sizes at Koyadori.
To understand the tsunami hazard in an area, you have to know “how big, how often.”
This estimation was an important contribution of the new research, said Bruce Jaffe, a research oceanographer at the U.S. Geological Survey not involved in the new study.
“Historically, most of the focus amongst tsunami geologists has been on establishing occurrence: how often the tsunamis hit and the time between two tsunamis,” said Jaffe.
Jaffe added that to understand the tsunami hazard in an area, you have to know “how big, how often.”
Jaffe said he’d rather know if an area was hit by a small or huge tsunami in the past rather than how often an area was inundated. “Of course, knowing both how big and how often is even better and allows, with enough data points, a probabilistic approach to tsunami hazard assessment.”
Site-Specific Tsunami Study
Ishimura said although their research was a successful case study of estimating paleotsunami sizes from the roundness of deposits, it is site specific.
“Specific values and patterns may be different in other places,” said Ishimura, “but we believe that some relationship may be found site by site.”
Jaffe agreed, noting that there are places where this approach may not work—a coastal plain region, for example, where water is not as concentrated as the narrow valley of Koyadori. But he said that the team’s “logic is sound and I would like to see the approach applied to other places in the world.”
“There has to be an additional step where the science gets back to the people who are planning the evacuation routes, determining building codes, and educating the public about the risk of tsunami,” said Jaffe. “This is one step of the journey to decrease loss of life and destruction from tsunamis.”
—Sarah Derouin (@Sarah_Derouin), Freelance Journalist
Citation:
Derouin, S. (2019), Gravel gives clues to the strength of paleotsunamis, Eos, 100, https://doi.org/10.1029/2019EO135161. Published on 09 October 2019.
Text © 2019. The authors. CC BY-NC-ND 3.0
Except where otherwise noted, images are subject to copyright. Any reuse without express permission from the copyright owner is prohibited.