A new, precisely detailed map of the continental United States puts data from more than a hundred different geologic maps into one interactive interface.
“Mineral resources or major infrastructure projects, even urban planning or disaster management, they all rely on maps.”
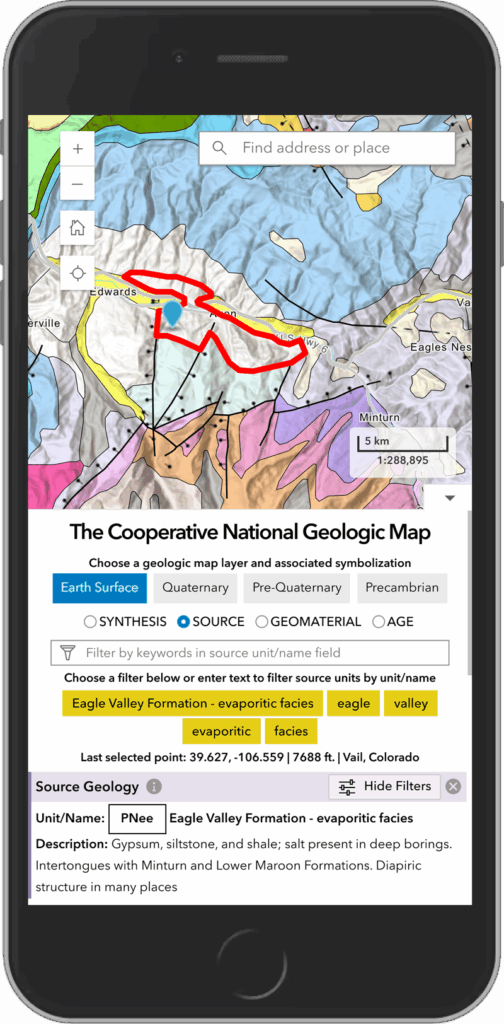
The Cooperative National Geologic Map from the U.S. Geological Survey (USGS) is the result of 3 years of development but builds on decades of mapping by geoscientists. Those efforts have yielded a multifunctional tool cataloging the complex rock strata that make up the conterminous United States: vast swaths of glacial till across the Great Plains, bands of ancient metamorphic rocks in the Appalachian Mountains, overlapping layers of volcanic rocks covering the Pacific Northwest, and more.
The audience for the new geologic map is broad: USGS encourages its use by everyone from the curious general public to professionals involved in searching for natural resources or identifying potential natural hazards.
“Geologic maps and topographic maps are the first stop for so many large-scale efforts,” said Juliet Crider, a geologist at the University of Washington who wasn’t involved in the map’s creation. “Mineral resources or major infrastructure projects, even urban planning or disaster management, they all rely on maps.”
The Cooperative National Geologic Map places a premium on such approachability. Rock layers are delineated by color, and users can click on them to learn more. Users can switch between views that differentiate rocks by source material or age or bounce between different geologic layers in one location. Citations to the original maps integrated into the Cooperative National Geologic Map and stored by the National Geologic Map Database let users dig into the source material.
“I view this as a very effective educational tool,” said David Soller, senior program scientist for the National Geologic Map Database at USGS and part of the map’s development team. “It’s an exciting way for people to begin to understand the geology and to see the similarities and the differences between how the geology was mapped in different areas at different times.”
Decades of Work, Brand-New Technology
The new map draws upon decades of surveying work categorizing the types and origins of the rocks and sediments that compose the geology of the United States.
These data come from many sources, including state geologic surveys and university geologists. These sources don’t always use the same units, a key challenge USGS mapmakers had to address. In fact, the new map is in part the product of a recent push by the Association of American State Geologists and the National Geologic Map Database to standardize geologic maps from across the country, said Sam Johnstone, a research geologist at USGS involved in the map’s creation.
“This map shows some of what we can do by harnessing the power of having that community standard,” Johnstone said.
USGS mapmakers also benefited from a new, largely automated process for adding disparate geologic maps into a single database. It relies on taxonomic categories like rock type and geologic age to standardize data from different maps, building on a process geologists have established over decades of work, Johnstone said.
“What we did is formalize some of that through this process that relies on taxonomies to select broad categories of units,” Johnstone said.
The new tool can integrate a new map in about a minute with little user input, according to Johnstone, meaning adding new and updated maps will be much easier and much faster than before.
A Work in Progress
Though the new map integrates data from different states, Crider noted it still reveals disparities in how geologic data are collected and published. The Idaho-Washington border, for example, stands out clearly in the new map, not because the geology changes suddenly, but because each state provided different information about the rock layers near the border.
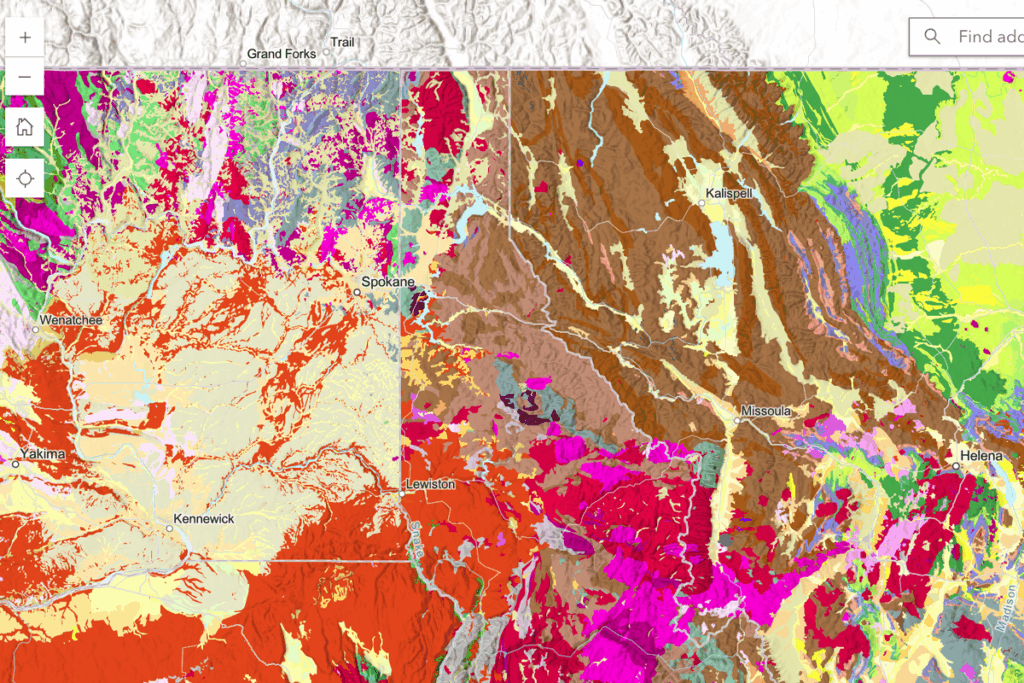
Such disparities are unavoidable on the new map, said Johnstone, because the goal was to integrate data without altering the original maps’ interpretations. The disparities point to opportunities for future collaboration across state agencies and with USGS, Crider suggested.
Future updates to the Cooperative National Geologic Map will include the addition of Alaska, Hawaii, Puerto Rico, and other U.S. territories. Further updates may include improved functionality in the map legend, as well as the ongoing addition of new geologic maps as they become available.
—Nathaniel Scharping (@nathanielscharp), Science Writer