The carbon cycle is at the heart of Earth’s planetary evolution. We see it manifest at all scales, through new crust forming along mid-ocean ridges, eruptions circling the Ring of Fire, and coral reefs shining along continental shelves. It is as fundamental to our understanding of Earth as those foundational processes we learn about in grade school, like photosynthesis and the water cycle. The carbon cycle, quite literally, shapes the world around us. But its impacts, like most geologic processes, take place on timescales that are difficult for us to fathom.
To fully appreciate this powerful and gradual process, it’s essential to be able to visualize it, and by marrying advanced computational techniques with comprehensive geologic data, a research group based at the University of Sydney has been able to do just this. The group, known as EarthByte, synthesizes large data sets in open-source software called GPlates to create simulations of Earth’s tectonic evolution over deep geologic time.
“It’s been a really fun journey seeing GPlates develop over the years. We’ve developed these models and built them from scratch.”
This software is accessible to geoscientists worldwide, allowing researchers to better visualize long-term surface processes and their relationship with plate tectonics. Because the carbon cycle occurs through tectonic processes such as subduction, mountain building, and rifting, EarthByte’s models of tectonic evolution can reveal how carbon moves through the lithosphere and mantle to tell a more hidden chapter of the geologic story, the deep carbon cycle.
Sabin Zahirovic, a postdoctoral research scientist at EarthByte, has been updating GPlates with components of the carbon cycle for 5 years. Along with conducting fieldwork, he and his colleagues manually comb through decades of literature to create the most detailed simulations possible.
“It’s been a really fun journey seeing GPlates develop over the years,” Zahirovic said. “We’ve developed these models and built them from scratch.”
For geoscientists studying deep carbon cycle processes, the software serves as an excellent tool to clearly visualize relevant data. Kevin Wong, a Ph.D. candidate at the University of Leeds in the United Kingdom and lead author of a 2019 review paper on the deep carbon cycle, noticed its advantages right away. “Having the ability to load up GPlates and relate the data I was playing with to a visual ‘something’ on a screen made interpreting my results easier,” he said.
As part of the Deep Carbon Observatory, an international research effort to understand the deep carbon cycle, Zahirovic and his colleagues have developed these kinds of animations to represent deep carbon cycle processes such as subduction zone volume flux, mantle plume evolution, and coral reef growth.
Paleogeography
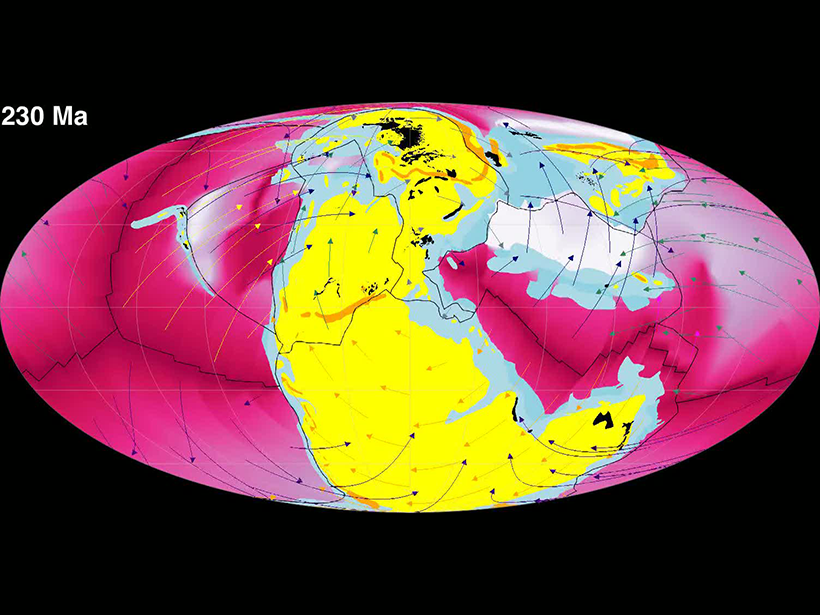
In this animation by Zahirovic, we can see a global schematic of some of the most vital components of the carbon cycle. In pink, we see oceanic crust that starts its journey at mid-ocean ridges and spreads out over millions of years to subduct under light blue continental shelves, taking carbon along for the ride. At these convergent margins, we see the inception of mountain ranges, represented in orange, stretching far along continental fore-arc basins. In black, we can see the eruption of large igneous provinces, vast accumulations of igneous rock that form above mantle plumes and are known to have contributed to a few of Earth’s major extinctions through massive carbon dioxide (CO2) outgassing.
Subduction Zones
Subduction zones move carbon deeper into Earth’s interior. But not all subduction zones subduct equally. Oceanic crust varies in thickness across space and time, and some portions are forced under their continental counterparts at faster rates than others. These discrepancies cause vast regional differences in “subduction zone volume flux,” modeled here in an animation codeveloped by former EarthByte researcher Madison East. During the breakup of Pangaea from 180 to 130 million years ago, one third of the total subduction volume since the Late Triassic (230 million years ago) occurred, causing a peak in subduction zone volume flux. East and her colleagues suggest that this then triggered an increase in mantle plume generation in the millions of years that followed.
The beauty of GPlates is that researchers can analyze tectonic properties like thickness and velocity on a global, deep-time scale. They can make general observations, such as higher rates of subduction may lead to higher rates of carbon-rich volcanic outgassing on both short- and long-term geologic timescales.
Carbonate Platforms
Examples of hidden mechanisms that modulate CO2 outgassing are carbonate platforms, seen in the video above. These carbonate reservoirs—formed through eons of carbonate accumulation from ancient reef structures, foraminifera, and other shallow marine contributors—accrete onto Earth’s crust at continental margins and add carbon to upwelling magma at subduction zones, influencing the amount of CO2 in the atmosphere for millions of years.
Jodie Pall, an environmental scientist and former EarthByte researcher, integrated locations of carbonate platforms with GPlates to model their relationship with subduction zones (the pink lines with teeth) since the Devonian, finding that the subsequent carbon contributed to ascending magma may have increased paleoatmospheric CO2 levels 60 to 40 million years ago.
Earth Blobs
Each animation displays a fundamental input and output relationship between Earth’s interior and exterior, as seen clearly in the above 4D animation developed by Zahirovic. In the animation, mantle plumes (orange blobs) rise in time-lagged response to subducting material (blue blobs). From 230 million years ago to 140 million years ago, subducting slabs dominate the scene. But soon after, mantle plumes take center stage and ascend to the surface all across the globe.
Mountain building enhances weathering, taking up CO2 and adding sediments to continental margins. These sediments flush into the ocean alongside carbonate ions and accumulate to form coral reefs and the shells of other marine calcifiers, which die off and deposit carbonate skeletons on the seafloor. Slowly but surely, these deposits amass in the depths, as highlighted by the work of lead EarthByte researcher Adriana Dutkiewicz,eventually subducting into the upper mantle and trickling into a plume. Geologically speaking, the plume quickly ascends and punches through the surface in 5–10 million years, releasing CO2 and starting the process anew.
“Over millions of years, these mechanisms control the atmospheric carbon dioxide budget present in the atmosphere and also the oxygen levels and climate,” said Tristan Salles, an EarthByte researcher.
Great Barrier Reef
Modeling this source to sink movement requires input from an endlessly complex chain of key players such as microorganisms, silicate rocks, and marine calcifiers, each occupying their own delicate niche in a large-scale environmental operation. If Earth were an organism on a strictly carbon-based diet, then these players would be the chemical mechanisms that metabolize the carbon, breaking it down and transferring it in various forms to specific niches.
To see this process in action, one needn’t look further than the formation of coral reefs. In this animation developed by Salles and his colleagues, we can see how coastal erosion, changing sea levels, and carbonate platform growth let a long shelf structure for the Great Barrier Reef (in pink) form 8,000 to 6,000 years ago.
Communicating the Deep Carbon Cycle
“This way we can squeeze 200 million years into a minute or less and convey a range of deep-time concepts, from the distribution of reefs to deep-sea carbonates and CO2 capture in the ocean crust through hydrothermal process.”
When thinking about the delicate processes that make up the carbon cycle, it is essential to disentangle anthropogenic influences from natural ones and understand how they both will change in the future. Animations can often communicate these complexities better than text. “[Using animation], we can squeeze 200 million years into a minute or less and convey a range of deep-time concepts, from the distribution of reefs to deep-sea carbonates and CO2 capture in the ocean crust through hydrothermal processes,” said Dietmar Müller, director of EarthByte and a professor of geophysics at the University of Sydney.
Piecing together and understanding these animations mean appreciating the role that plate tectonics has in shaping our world, its climate, and all its biological richness. “But we should not take this for granted,” Müller added, “as we are on a path of wreaking havoc with our planetary habitability that plate tectonics have created for us over hundreds of millions of years.”
—Christian Fogerty (@ChristianFoger1), Science Writer
Citation:
Fogerty, C. (2020), Visualizing the deep carbon cycle, Eos, 101, https://doi.org/10.1029/2020EO145249. Published on 12 June 2020.
Text © 2020. The authors. CC BY-NC-ND 3.0
Except where otherwise noted, images are subject to copyright. Any reuse without express permission from the copyright owner is prohibited.