• About
  • Sections
  • Topics
    • Climate
    • Earth Science
    • Oceans
    • Space & Planets
    • Health & Ecosystems
    • Culture & Policy
    • Education & Careers
    • Opinions
  • Projects
    • Postcards From the Field
    • ENGAGE
    • Editors’ Highlights
    • Editors’ Vox
    • Eos en Español
    • Eos 简体中文版
    • Print Archive: 2015–2025
  • Science Policy Tracker
  • Blogs
    • Research & Developments
    • The Landslide Blog
  • Newsletter
  • Submit to Eos
  • AGU.org
  • Career Center
  • Join AGU
  • Give to AGU
  • About
  • Sections
  • Topics
    • Climate
    • Earth Science
    • Oceans
    • Space & Planets
    • Health & Ecosystems
    • Culture & Policy
    • Education & Careers
    • Opinions
  • Projects
    • Postcards From the Field
    • ENGAGE
    • Editors’ Highlights
    • Editors’ Vox
    • Eos en Español
    • Eos 简体中文版
    • Print Archive: 2015–2025
  • Science Policy Tracker
  • Blogs
    • Research & Developments
    • The Landslide Blog
  • Newsletter
  • Submit to Eos
Skip to content
  • AGU.org
  • Career Center
  • Join AGU
  • Give to AGU
Eos

Eos

Science News by AGU

Support Eos
Sign Up for Newsletter
  • About
  • Sections
  • Topics
    • Climate
    • Earth Science
    • Oceans
    • Space & Planets
    • Health & Ecosystems
    • Culture & Policy
    • Education & Careers
    • Opinions
  • Projects
    • Postcards From the Field
    • ENGAGE
    • Editors’ Highlights
    • Editors’ Vox
    • Eos en Español
    • Eos 简体中文版
    • Print Archive: 2015–2025
  • Science Policy Tracker
  • Blogs
    • Research & Developments
    • The Landslide Blog
  • Newsletter
  • Submit to Eos

D. N. Williams

(top) Observed and (bottom) simulated seasonal mean (December–January–February) 2-meter surface air temperature data.
Posted inScience Updates

A More Powerful Reality Test for Climate Models

by P. J. Gleckler, C. Doutriaux, P. J. Durack, K. E. Taylor, Y. Zhang, D. N. Williams, E. Mason and J. Servonnat 3 May 201622 August 2022

A new climate model evaluation package will deliver objective comparisons between models and observations for research and model development and provide a framework for community engagement.

Posted inScience Updates

Better Tools to Build Better Climate Models

by D. N. Williams 9 February 201614 June 2022

A Department of Energy collaboration aims to make climate model development faster and more efficient by creating a prototype of a system for testing model components.

Posted inScience Updates

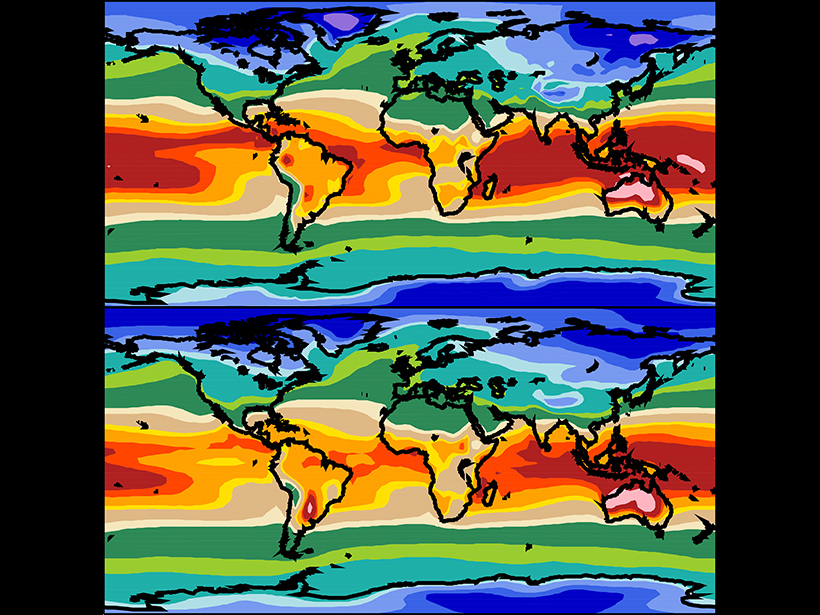
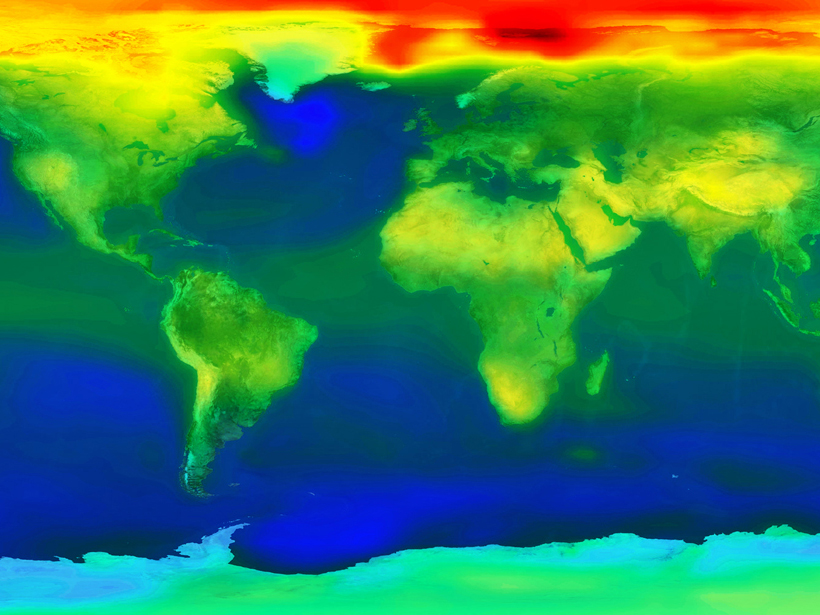
Visualization and Analysis Tools for Ultrascale Climate Data

by D. N. Williams 21 October 201411 January 2023

The Ultrascale Visualization Climate Data Analysis Tools (UV-CDAT) software project enables climate researchers to solve current and emerging data analysis and visualization challenges.

A view of a bridge, with the New Orleans skyline visible in the distance between the bridge and the water. A purple tint, a teal curved line representing a river, and the text “#AGU25 coverage from Eos” overlie the photo.

Features from AGU Publications

Research Spotlights

Which Countries Are Paying the Highest Price for Particulate Air Pollution?

28 January 202628 January 2026
Editors' Highlights

Cows, Coal, and Chemistry: The Role of Photochemistry in Methane Budget

27 January 202623 January 2026
Editors' Vox

Bridging the Gap: Transforming Reliable Climate Data into Climate Policy

16 January 202616 January 2026
Eos logo at left; AGU logo at right

About Eos
ENGAGE
Awards
Contact

Advertise
Submit
Career Center
Sitemap

© 2026 American Geophysical Union. All rights reserved Powered by Newspack