
Seismic waveform inversion is inherently non-linear. New objective functions based on optimal transport theory mitigate nonlinearity yielding stable solutions without need for accurate initial models.
Editors’ Highlights
Posted inEditors' Highlights
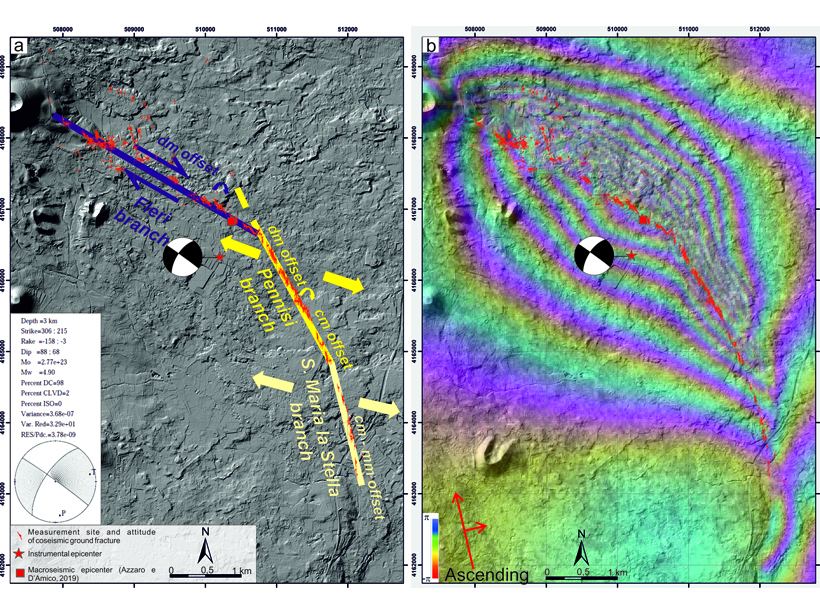
Volcano—Tectonic Interactions at Etna
Mapping of a 2018 earthquake that ruptured the eastern flank of Mount Etna shows that it occurred on a tectonic lineament that predates the volcano, and the kinematics match nearby tectonic domains.
Posted inEditors' Highlights
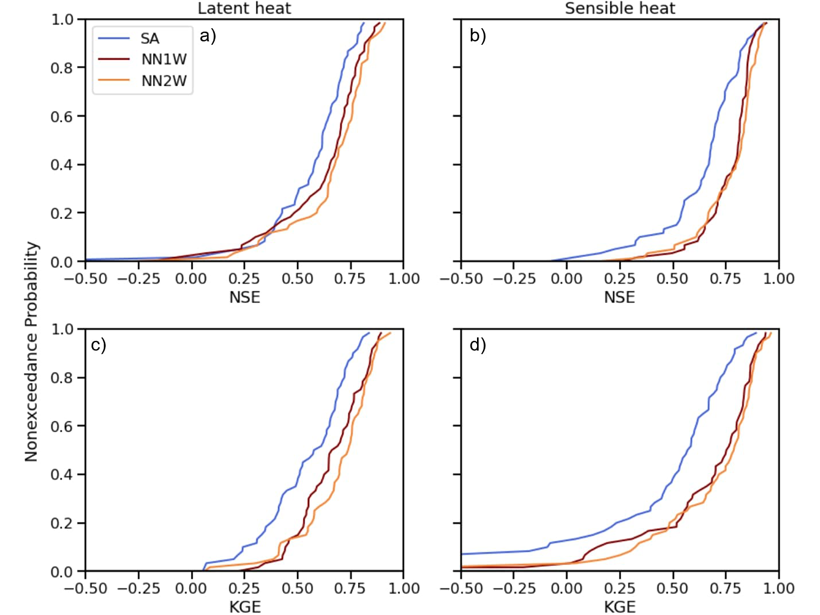
Combining Deep Learning Methods with Process-based Models
Using turbulent heat fluxes as an example, a new study shows that exchange of information between process-based models and deep learning methods may lead to improved predictions.

Posted inEditors' Highlights
A New Model for Self-Organized Pattern Formation
Scale-dependent feedbacks in time, rather than in space, result in a new type of competition, explaining the regularly patterned landscape of Big Cypress National Preserve in South Florida.

Posted inEditors' Highlights
Sea-Level Science Coordination: A U.S. and Global Concern
Sea-level rise is happening. There are basic science needs for supporting decision making for sea-level adaptation efforts and challenges to making information available to stakeholders.
Posted inEditors' Highlights
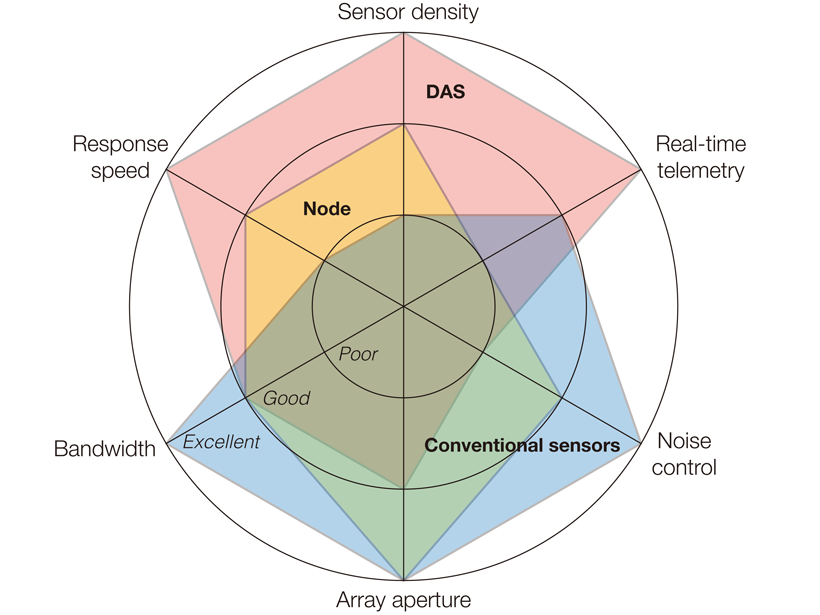
Aftershocks and Fiber Optics
Internet cables can be transformed into a string of dense seismic sensors, and this approach has now been shown to be highly useful for quickly monitoring seismicity after major earthquakes.
Posted inEditors' Highlights
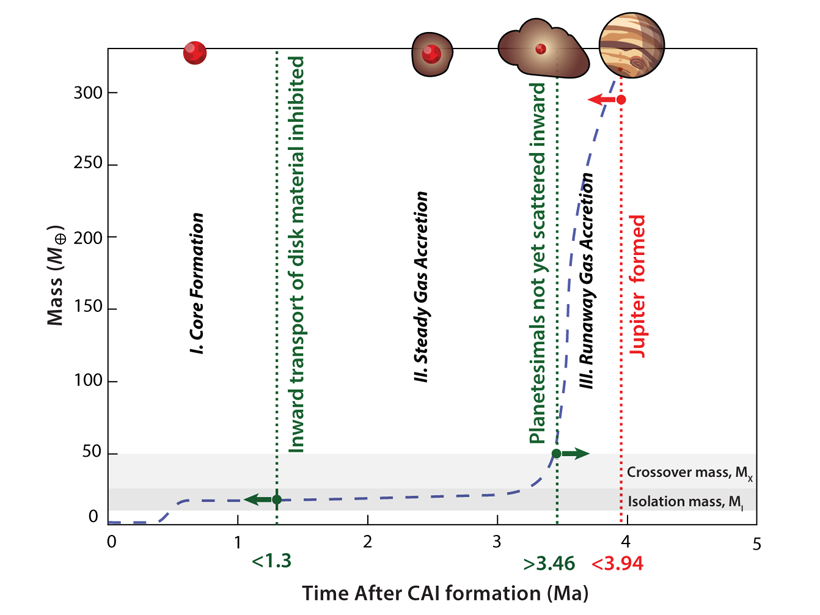
Fingerprints of Jupiter Formation
Meteorite isotopes, meteorite paleomagnetics, and planet formation models collectively show Jupiter formation via first slow then fast collection of material by core accretion in <5 million years.
Posted inEditors' Highlights
Modeling Urban-Weather Effects Can Inform Aerial Vehicle Flights
Microscale modeling can be used to understand and predict urban weather with sufficient detail to inform and support flight safety for crewed and uncrewed aerial vehicles.

Posted inEditors' Highlights
Raising Central American Orography Improves Climate Simulation
Elevation of Central American orography significantly reduces the pervasive tropical rainfall bias by blocking the easterlies and consequently warming the northeastern tropical Pacific.
Posted inEditors' Highlights
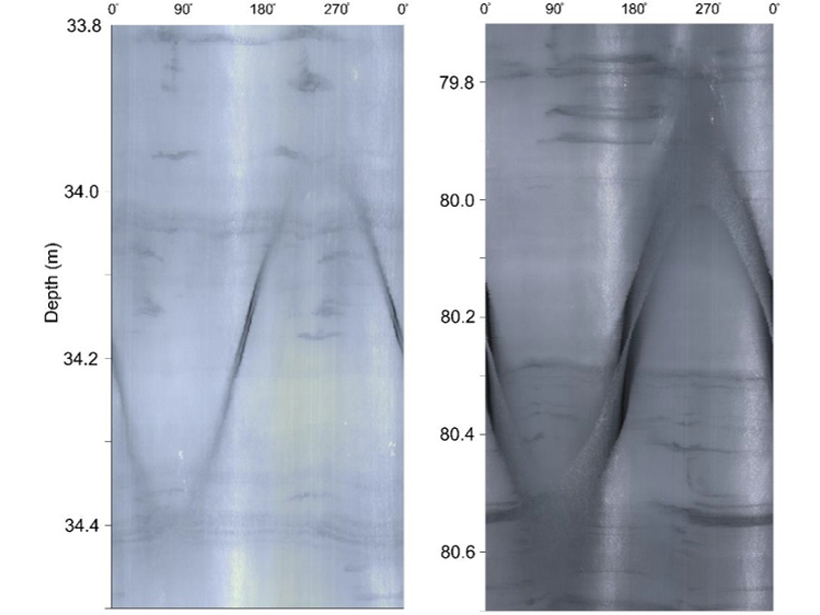
Evidence of Crevasses Transporting Heat Deep into Greenland Ice
Crevasses are a feature of ice sheets but how deep they extend has been a mystery. Now crevasse traces have been visually identified to 265 meters in a borehole in a fast-moving outlet glacier.