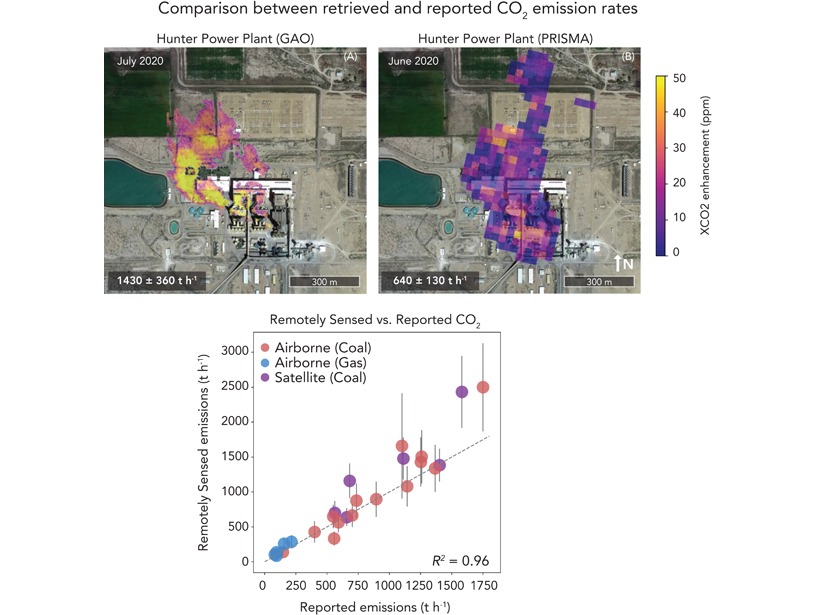
Airborne and satellite imaging spectrometers provide accurate quantifying of CO2 emissions at the facility scale, which is important to emission budgets and policy constraints.
Editors’ Highlights

Posted inEditors' Highlights
Earthquake Rupture Solution is Up in the Air
Perhaps the most complex earthquake rupture ever studied is further constrained by signals from Earth’s ionosphere.

Posted inEditors' Highlights
How to Assess the Quality of Space Weather Forecasts?
The assessment of space weather event forecasts would benefit from more nuanced approaches that take account of event intensities peaking near the thresholds used to identify such events.
Posted inEditors' Highlights
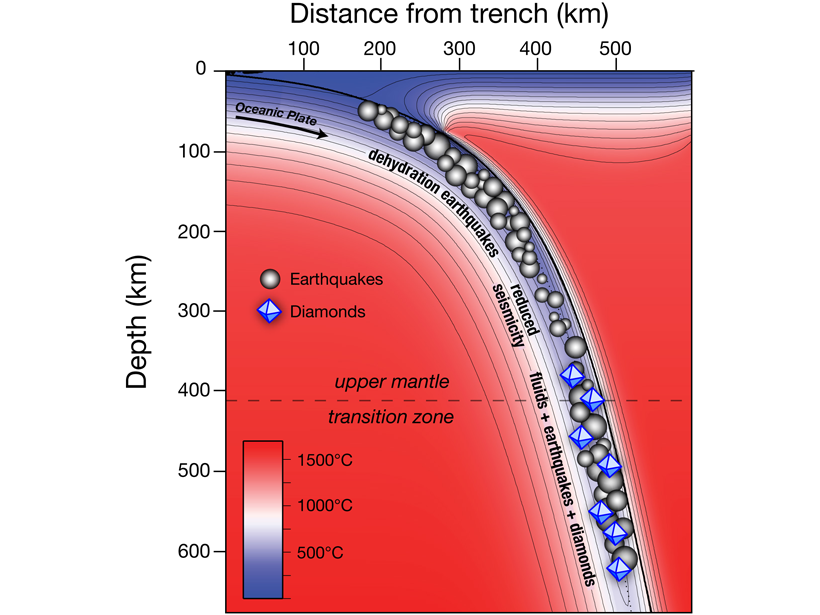
Diamonds Are at Fault
Deep-seated earthquakes in subduction zones are related to diamond formation.

Posted inEditors' Highlights
What’s the Beef About Methane?
Progress has been made to reduce methane emission intensity from livestock (the amount of methane per unit of protein), but where are the greatest opportunities to reduce this methane source further?
Posted inEditors' Highlights
Severe Radiation Storms Pose Health Risk to Air Travel
Simulations of radiation storm fluxes on real flight paths highlight how severe space weather could expose aircrew and passengers on busy transatlantic routes to significant radiation doses.
Posted inEditors' Highlights
How Do Croplands Reduce CO2 During the Growing Season?
Regional variations in the seasonal drawdown of atmospheric CO2 can be used as a benchmark for evaluating models and satellite-derived estimates of land carbon uptake.
Posted inEditors' Highlights
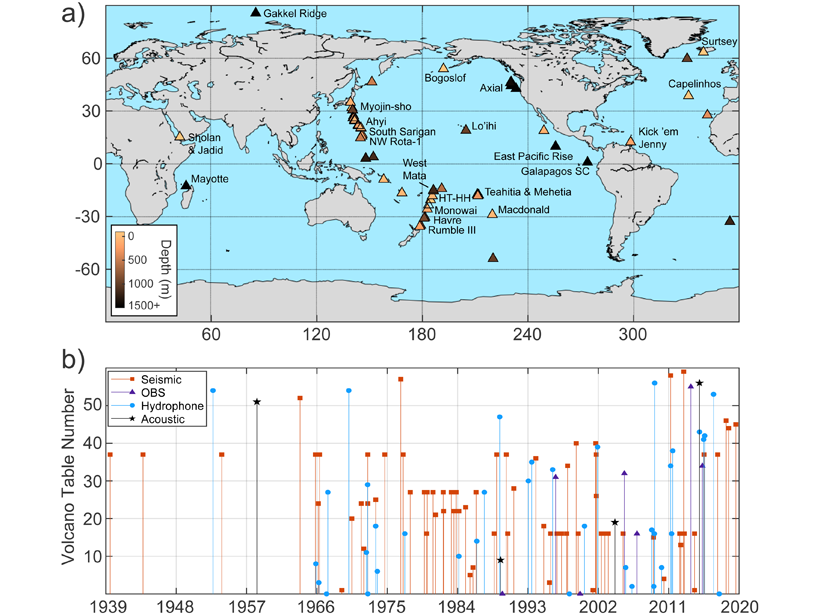
A Comprehensive Review of Submarine Volcano Seismoacoustics
Although most of Earth’s lava erupts beneath the oceans, submarine volcanoes are comparatively understudied, but a new review of submarine volcano seismoacoustics provides a framework for future work.
Posted inEditors' Highlights
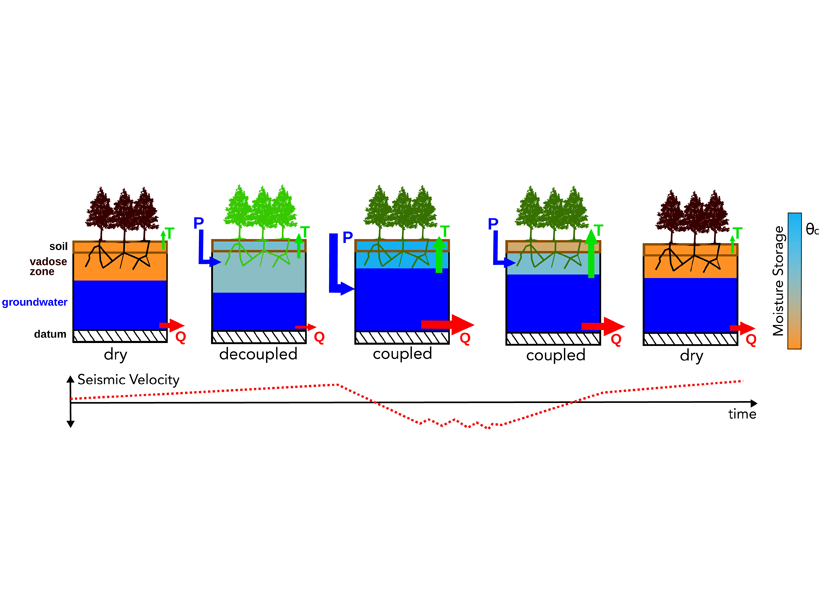
Understanding How Himalayan Water Towers Fill and Drain
Seismic data reveal how water is accumulated and released by Himalayan groundwater reservoirs which are key for predicting future freshwater resources for a large part of South Asia.
Posted inEditors' Highlights
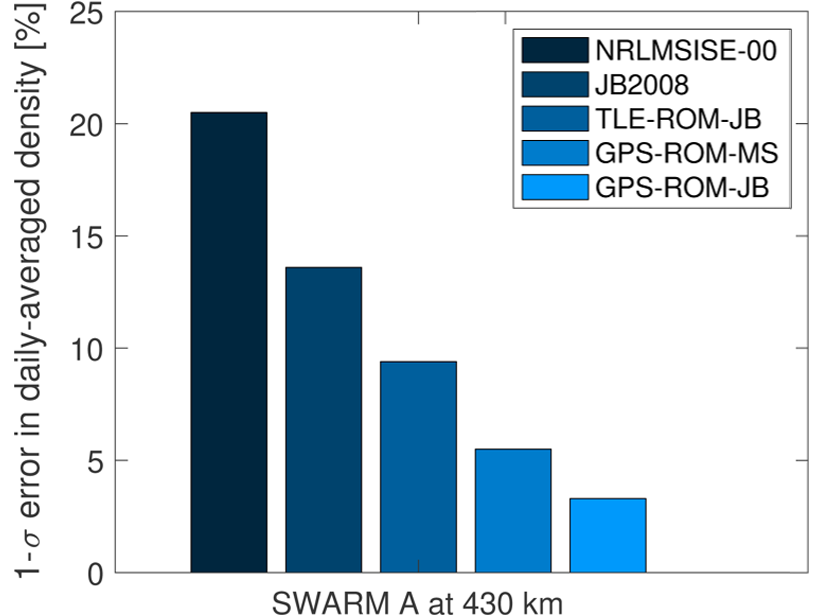
Better Thermospheric Monitoring is Vital to Space Safety
Better real-time estimates of thermospheric density are vital to the safe management of satellite traffic in Low Earth orbit, ensuring those satellites continue to deliver critical services.