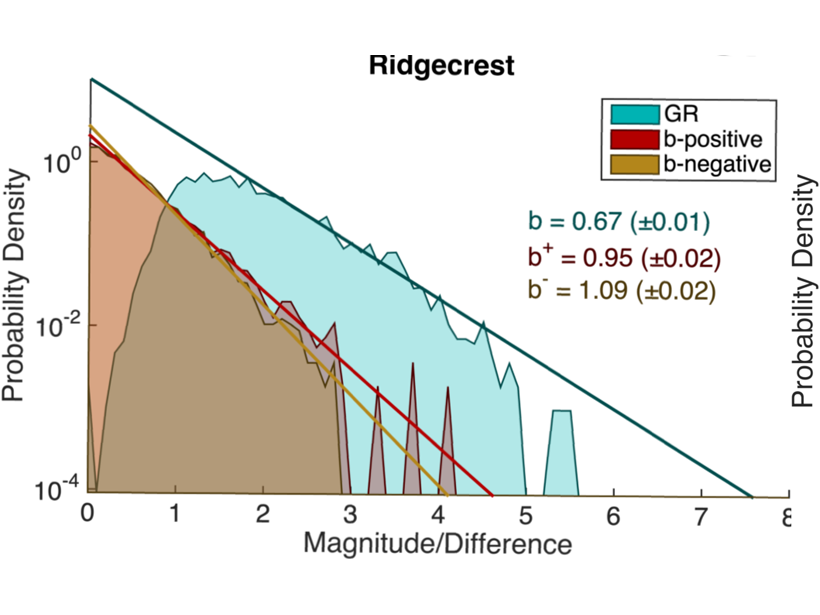
The b-value, which describes the fraction of large versus small earthquakes, is less sensitive to transient changes in detection threshold and may improve the detection of precursory changes.
Editors’ Highlights

Posted inEditors' Highlights
New Land Surface Air Temperature Global Dataset
The fifth major update of land surface air temperature data from the Climatic Research Unit and the Met Office has extended the time series, included more stations, and used better processing methods.

Posted inEditors' Highlights
Dawn Storms at Jupiter
Juno spacecraft observations provide the first global description of dawn storms in Jupiter’s aurorae, from their initiation to their end.
Posted inEditors' Highlights
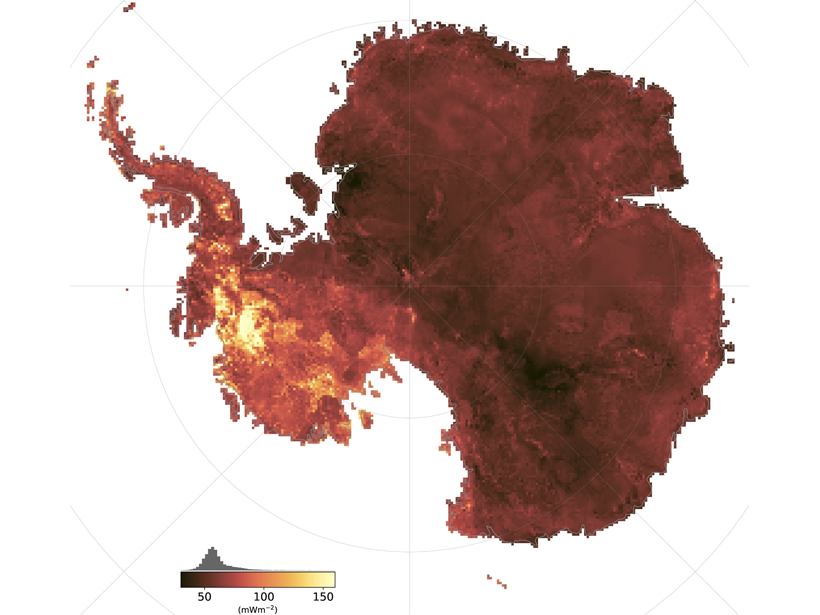
Taking the Temperature of Antarctica’s Crust
How do you measure the geothermal heat flux in a continent covered by an ice-sheet? A new study uses correlations of diverse global observables and produces a heat flow map of the entire Antarctica.
Posted inEditors' Highlights
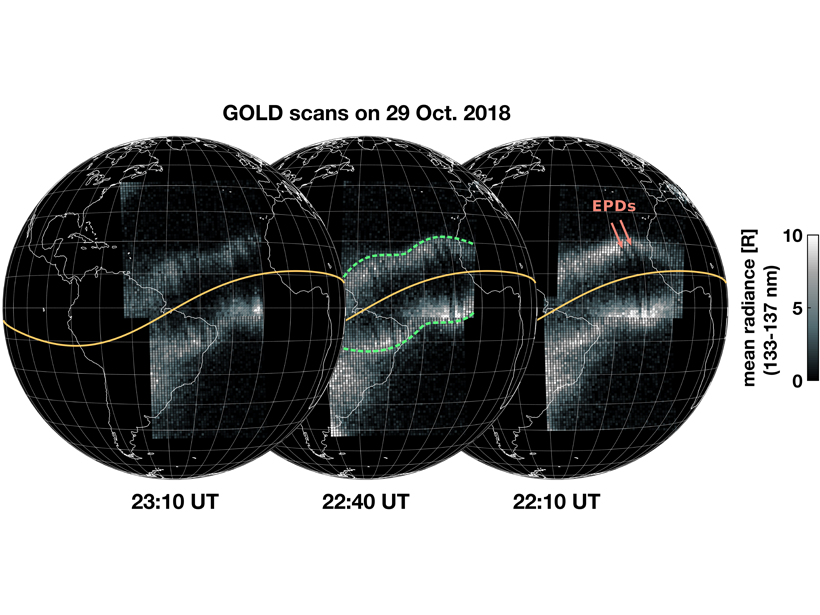
GOLD Sees Quasi-Stationary Waves in the Nighttime Ionosphere
The wave-like features in the pre-midnight ionosphere are not moving, vary strongly from day-to-day, and are often associated with the equatorial plasma bubbles, but their origin is still unknown.
Posted inEditors' Highlights
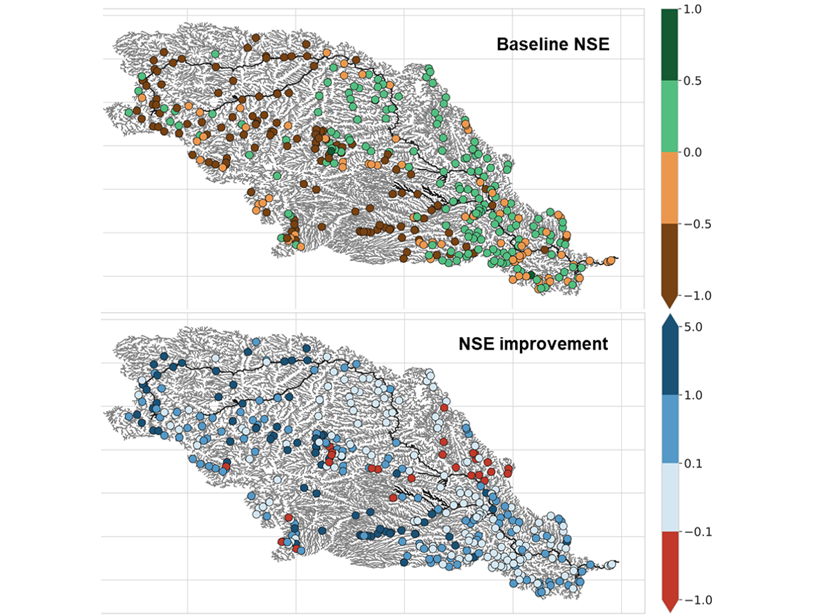
Gauging Ungauged River Basins with Smart Remote Sensing
A clever combination of hydrologic modelling and discharge estimates from the Landsat satellite provides good discharge estimates throughout the Missouri river basin.

Posted inEditors' Highlights
Watering Down the Mantle
The cooling of planet Earth over time increased the water carrying capacity of the mantle and could have shrunk the oceans.

Posted inEditors' Highlights
New Global Surface Temperature Dataset Spans 170 Years
HadCRUT5, the new version of the Met Office Hadley Centre/Climatic Research Unit global surface temperature dataset from 1850 to 2018, has extended and improved the previous temperature record.

Posted inEditors' Highlights
When Will the Next Failure Be?
Unprecedented images of fracture networks in laboratory scale experiments mixed with machine learning algorithms help predict the timing of the next failure.

Posted inEditors' Highlights
Thawing Permafrost May Cause Streams to Cool
Permafrost thawing associated with climate warming increases contributions to streamflow by deeper, cooler groundwater flow paths, which may result in lower summer stream temperatures.