• About
  • Special Reports
  • Topics
    • Climate
    • Earth Science
    • Oceans
    • Space & Planets
    • Health & Ecosystems
    • Culture & Policy
    • Education & Careers
    • Opinions
  • Projects
    • Postcards From the Field
    • ENGAGE
    • Editors’ Highlights
    • Editors’ Vox
    • Eos en Español
    • Eos 简体中文版
    • Print Archive: 2015–2025
  • Policy Tracker
  • Blogs
    • Research & Developments
    • The Landslide Blog
  • Newsletter
  • Submit to Eos
  • AGU.org
  • Career Center
  • Join AGU
  • Give to AGU
  • About
  • Special Reports
  • Topics
    • Climate
    • Earth Science
    • Oceans
    • Space & Planets
    • Health & Ecosystems
    • Culture & Policy
    • Education & Careers
    • Opinions
  • Projects
    • Postcards From the Field
    • ENGAGE
    • Editors’ Highlights
    • Editors’ Vox
    • Eos en Español
    • Eos 简体中文版
    • Print Archive: 2015–2025
  • Policy Tracker
  • Blogs
    • Research & Developments
    • The Landslide Blog
  • Newsletter
  • Submit to Eos
Skip to content
  • AGU.org
  • Career Center
  • Join AGU
  • Give to AGU
Eos

Eos

Science News by AGU

Support Eos
Sign Up for Newsletter
  • About
  • Special Reports
  • Topics
    • Climate
    • Earth Science
    • Oceans
    • Space & Planets
    • Health & Ecosystems
    • Culture & Policy
    • Education & Careers
    • Opinions
  • Projects
    • Postcards From the Field
    • ENGAGE
    • Editors’ Highlights
    • Editors’ Vox
    • Eos en Español
    • Eos 简体中文版
    • Print Archive: 2015–2025
  • Policy Tracker
  • Blogs
    • Research & Developments
    • The Landslide Blog
  • Newsletter
  • Submit to Eos

Editors’ Highlights

Five plots showing the paleosecular variation of the geomagnetic field in the composite record from Black Sea cores.
Posted inEditors' Highlights

Marine Isotope Stage 6: First High-Resolution Field Record

by Mark J. Dekkers 12 May 202127 January 2023

A 200-year resolution record from the Black Sea for marine isotope stage 6 (130-180 ka) shows a stable geomagnetic field.

Two maps of the Japanese islands showing distribution of volcanoes (top) and areas of large crustal earthquakes analyzed in this study (bottom).
Posted inEditors' Highlights

The First Systematic Search for Enervated Earthquakes

by Satoshi Ide 11 May 20218 December 2022

High quality data from Japan provides answers on where and when “enervated” earthquakes occur.

Map of the eastern Mediterranean showing modeled wave height from a magnitude 7.7 normal fault earthquake sourced offshore of southern Crete.
Posted inEditors' Highlights

Was the AD 365 Mediterranean Earthquake Normal?

by T. Parsons 10 May 202114 September 2022

The great AD 365 earthquake at Crete has implied a locked Hellenic subduction zone that can produce more earthquakes to threaten Mediterranean coastlines. But what if wasn’t a subduction zone event?

Plot showing smoke from California observed over Europe by lidar.
Posted inEditors' Highlights

The Promise of Spaceborne High Spectral Resolution Lidar

by C. Cappa 7 May 202126 October 2021

New spaceborne high spectral resolution lidar measurements provide a new view of global aerosols.

Top figure shows tracking of mesoscale convective systems globally at hourly and 10-km resolution; bottom figure is a world map showing amount of rainfall that MCSs account for.
Posted inEditors' Highlights

New Global Mesoscale Convective System Tracking Database

by C. Zhang 6 May 20213 February 2022

A 20-year high-resolution global mesoscale convective system tracking database reveals the characteristics of mesoscale convective systems and their significant contributions to global rainfall.

Plots showing probability distributions derived from measurements of 14C in long-chain fatty acids
Posted inEditors' Highlights

A 2700-year Record of Permafrost Thaw Sensitivity to Climate

by Susan Trumbore 5 May 20219 December 2021

Changes in the 14C ages of carbon and biomarkers deposited at the mouth of a river draining a permafrost watershed track responses of regional thaw depth to past warming and cooling.

Two models of the surface magnetic field of Saturn
Posted inEditors' Highlights

Saturn’s Dynamo Illuminates its Interior

by F. Nimmo 5 May 202115 March 2022

Saturn’s oddly symmetrical magnetic field can be explained by models in which the active dynamo region is overlain by a thick, stable layer cooled more strongly at the poles.

Maps of London showing the average surface daytime temperature, vegetation activity and Leaf area index during summer.
Posted inEditors' Highlights

Urban Vegetation Key Regulator for Heat Island Intensity

by D. Wuebbles 4 May 202123 February 2023

Satellite data reveals that urban vegetation, especially urban forests, is the most important factor regulating Urban Heat Island intensity.

Image of dune aurora taken by a citizen scientist
Posted inEditors' Highlights

Dune Aurora Explained by Satellite-Ground Studies

by Mary Hudson 4 May 202116 March 2023

Spacecraft observations support the mechanism for explaining auroral dunes observed from the ground by citizen scientists.

Two maps of Europe showing the fraction of days during May-August 2018 when estimated soil moisture fell below a critical threshold based on daily maximum temperature (top) and evaporative fraction (bottom) compared to the 1979-2018 average.
Posted inEditors' Highlights

Dry Soils Enhanced the 2018 Heatwave in Northern Europe

by Susan Trumbore 3 May 202120 December 2022

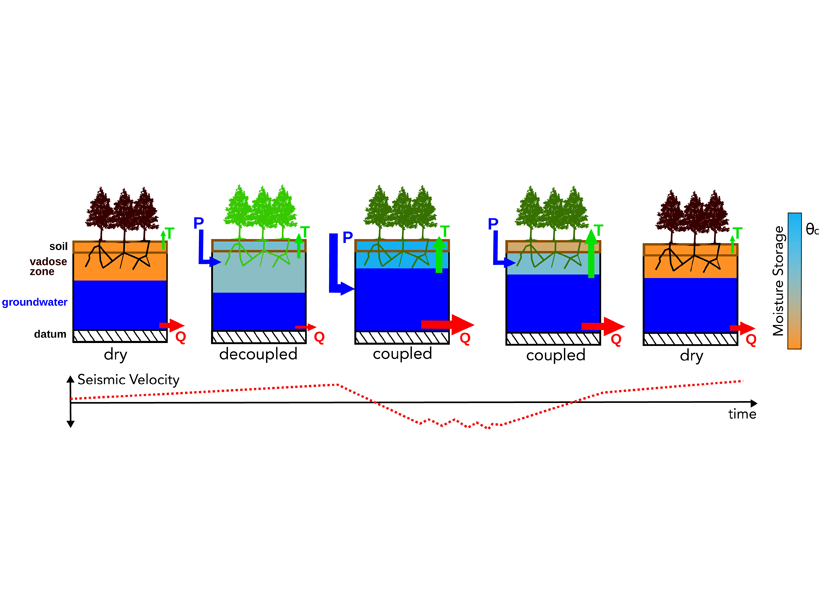
A range of observations show that a shift in land-atmosphere coupling exacerbated the hot drought experienced in Europe in 2018.

Posts pagination

Newer posts 1 … 77 78 79 80 81 … 119 Older posts
Over a dark blue-green square appear the words Special Report: The State of the Science 1 Year On.

Features from AGU Publications

Research Spotlights

How the 2024 Solar Superstorm Drained Earth’s Radiation Belt

14 September 202614 September 2026
Editors' Highlights

Extreme Equatorial Storms are Larger and More Persistent Under Warming

15 September 202614 September 2026
Editors' Vox

In Appreciation of AGU’s Outstanding Reviewers of 2025

14 September 202610 September 2026
Eos logo at left; AGU logo at right

About Eos
ENGAGE
Awards
Contact

Advertise
Submit
Career Center
Sitemap

© 2026 American Geophysical Union. All rights reserved Powered by Newspack