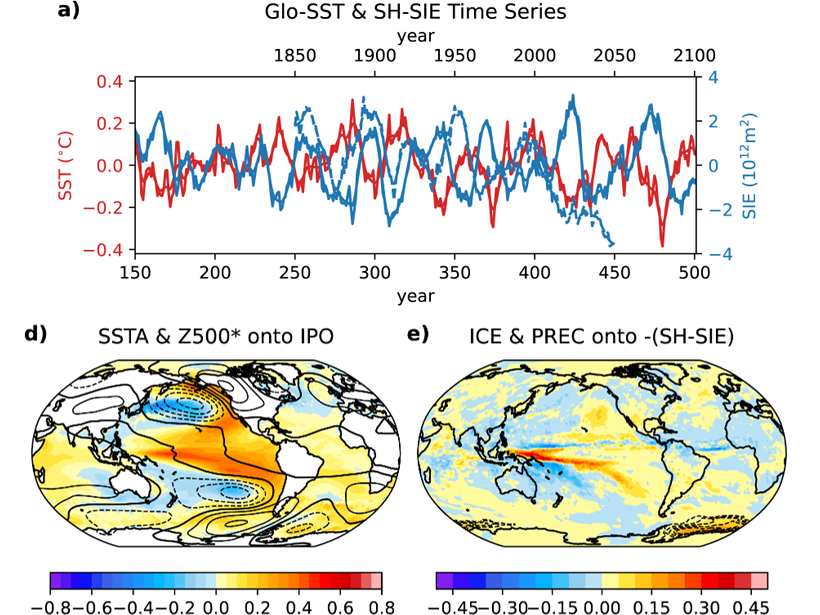
Porting and optimizing CESM1.3 to run on the TaihuLight computer enabled an astounding 750 years of simulation with 0.25° grid spacing for land & atmosphere and 0.1° grid spacing for ocean & sea ice.
Editors’ Highlights
Posted inEditors' Highlights
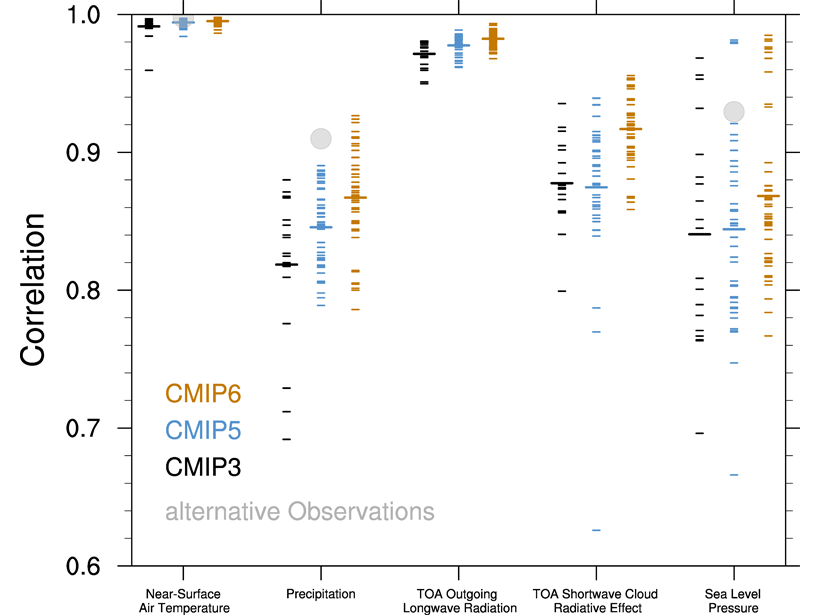
Climate Modeling Progress in the Past 15 Years
An assessment and comparison of the performances of climate models participating in three phases of the Coupled Model Intercomparison Project (CMIP3, CMIP5 and CMIP6).
Posted inEditors' Highlights
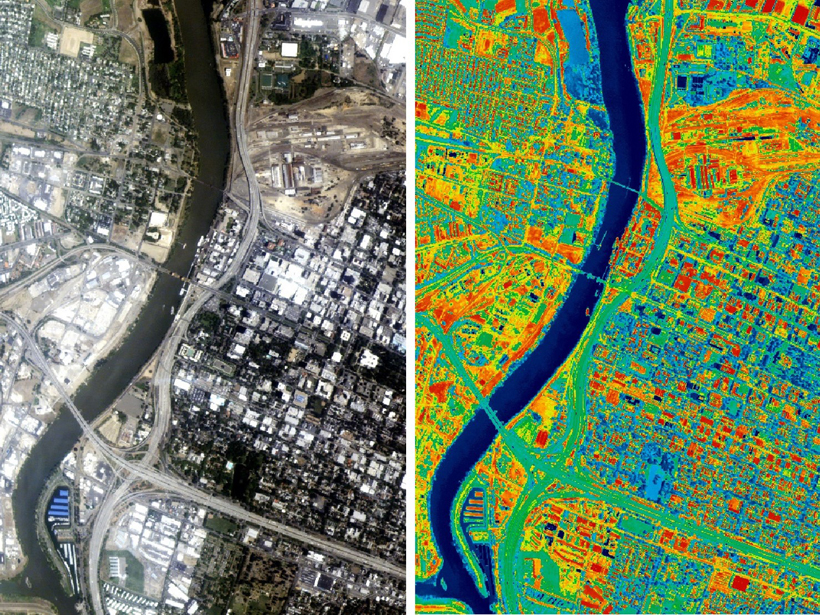
Modeling Interactions Between Cities and Climate Across Scales
With more than half of humanity living in cities, the ability to model urban-climate interactions at relevant spatial scales is increasingly important.

Posted inEditors' Highlights
Radio on Jupiter, Brought to You by Ganymede
Another first from NASA’s Juno spacecraft: the detection of Jupiter radio emissions influenced by the moon Ganymede, over a range of about 250 kilometers in the polar region of Jupiter.
Posted inEditors' Highlights
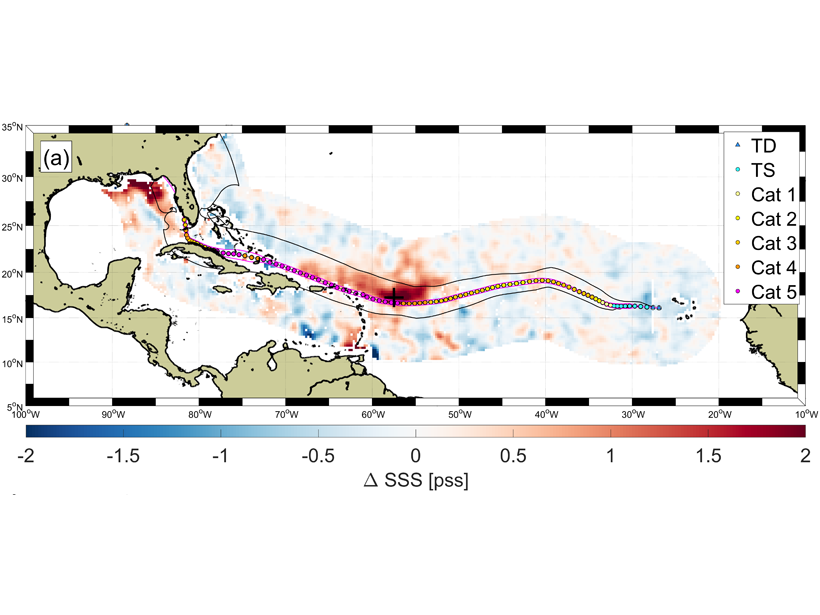
Hurricanes Wakes Show Asymmetrical Response in Ocean Salinity
It’s well known that hurricanes can substantially impact ocean surface temperature, but a new study shows they can also induce an ocean salinity response in unexpected ways.
Posted inEditors' Highlights
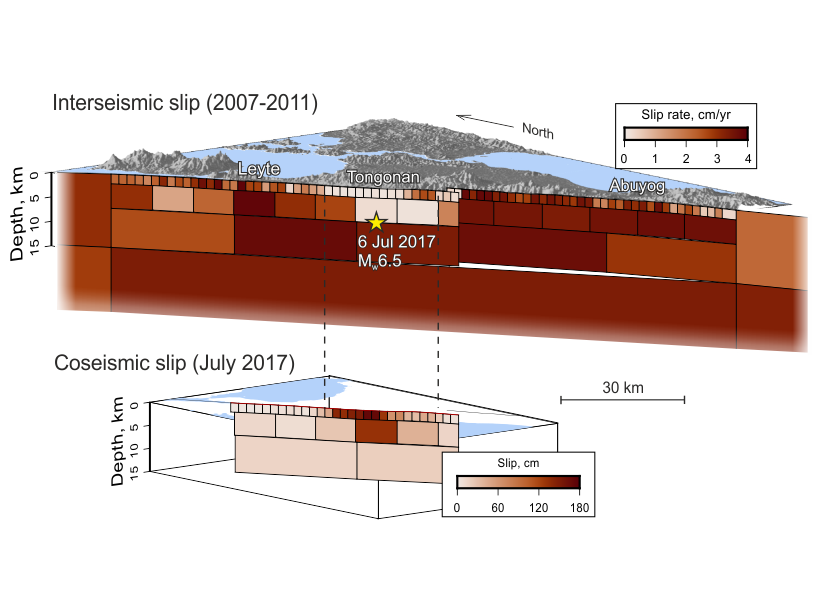
A New Picture of Seismogenesis on the Philippine Fault
Long-time series of satellite observation reveal that the creeping segment of the Philippine Fault is also capable of producing strong earthquakes, and show where these earthquakes might occur.
Posted inEditors' Highlights
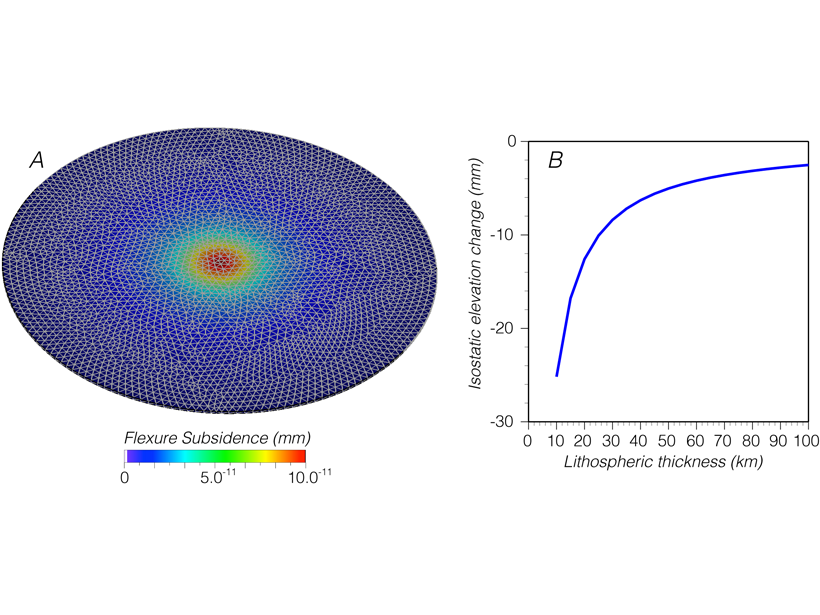
Going Down: How Do Cities Carry That Weight?
Calculations show that the added weight of growing cities can lead to tens of millimeters of subsidence, an effect that needs to be considered for coastal cities under threat by sea-level rise.
Posted inEditors' Highlights
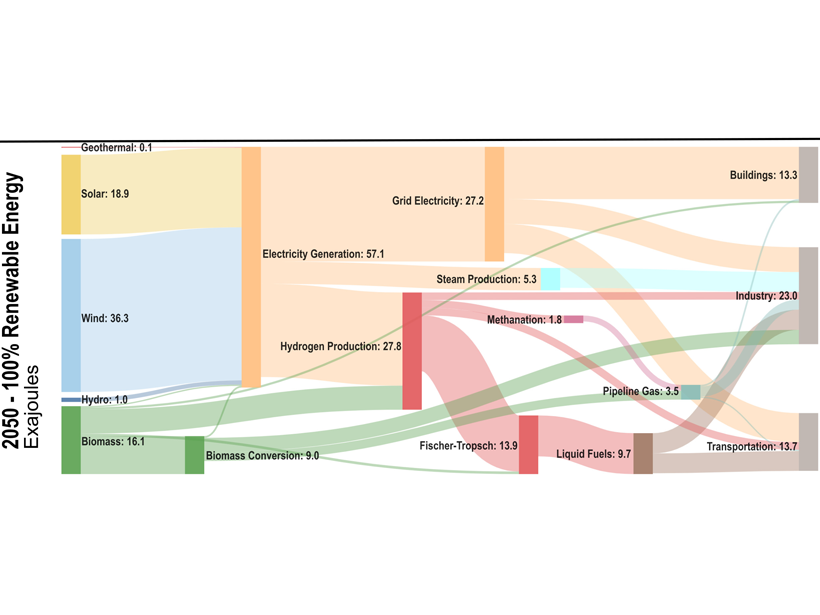
Deep Decarbonization? Yes We Can!
Modeling the U.S. energy system demonstrates several pathways to net-zero CO2 emissions by 2050. The pathway with the lowest cost, 0.2–1.2% of GDP, relies on >80% contribution of renewables.
Posted inEditors' Highlights
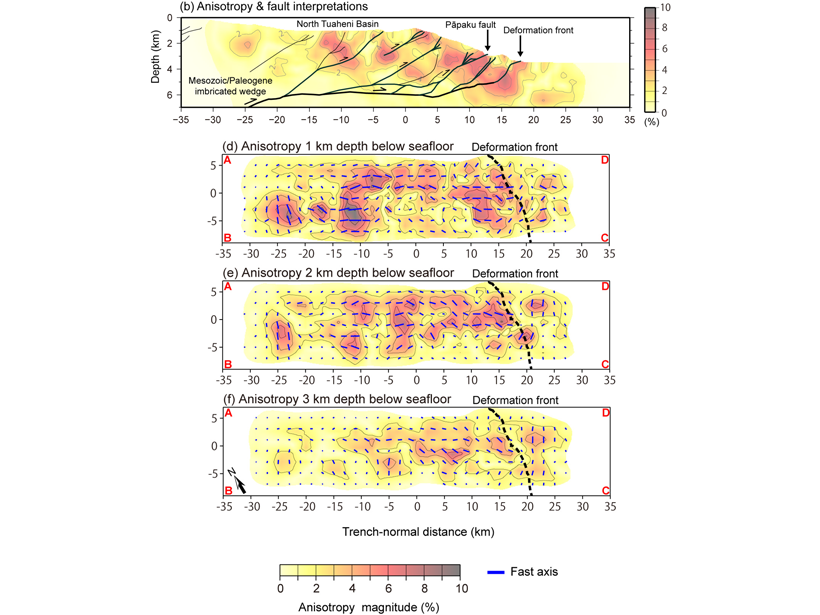
Fault Related Anisotropy in the Hikurangi Subduction Zone
A new study provides the first high-resolution three-dimensional anisotropic P-wave velocity model of the shallow part of the Northern Hikurangi subduction zone offshore New Zealand.
Posted inEditors' Highlights
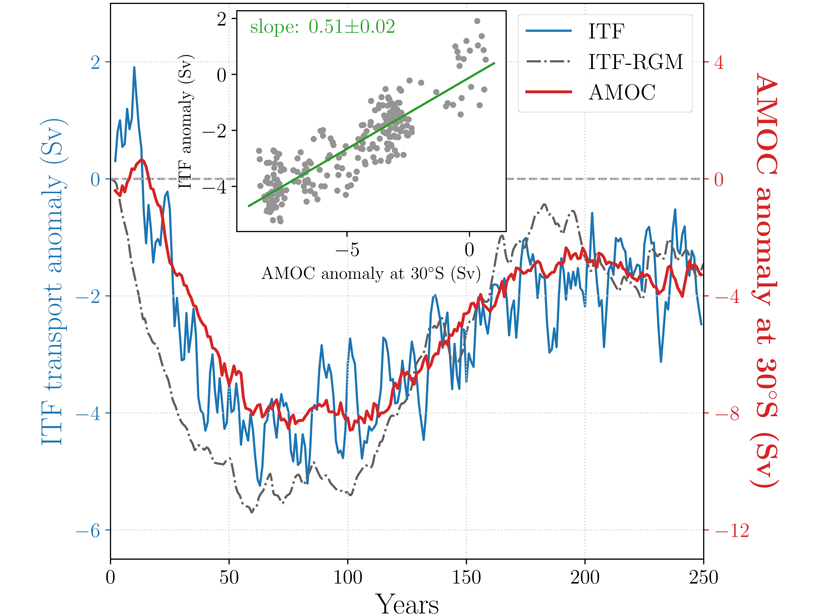
What Causes Centennial Changes in the Indonesian Throughflow?
Transient long-term changes in the strength of the Indonesian Throughflow are unexpectedly linked to circulation changes in the remote high-latitude North Atlantic.