
10Be and 26Al concentrations in river sand reveal an increase in erosion rate in the Brazilian Highlands consistent with the Mid-Pleistocene Transition, a major climatic shift that occurred about 1 million years ago.
Editors’ Highlights

Posted inEditors' Highlights
Unusual Occurrence of STEVE: An Aurora-Like Glow
STEVE is a mysterious purple-white arc near the aurora, typically seen after space disturbances called substorms. A new study reveals a rare STEVE event without a substorm, prompting questions about its origin.
Posted inEditors' Highlights
The Future of Martian Paleomagnetism
Samples collected by the Perseverance Rover have great potential for providing insights into the history of Mars’ magnetic field.

Posted inEditors' Highlights
Improvements to Measuring the Ups and Downs of the Landscape
If you are a jazz fan, you may be familiar with Ella Fitzgerald singing ‘How deep is the ocean, how high is the sky’. Using data from the Shuttle Radar Topography Mission we now know how high the land really is.
Posted inEditors' Highlights
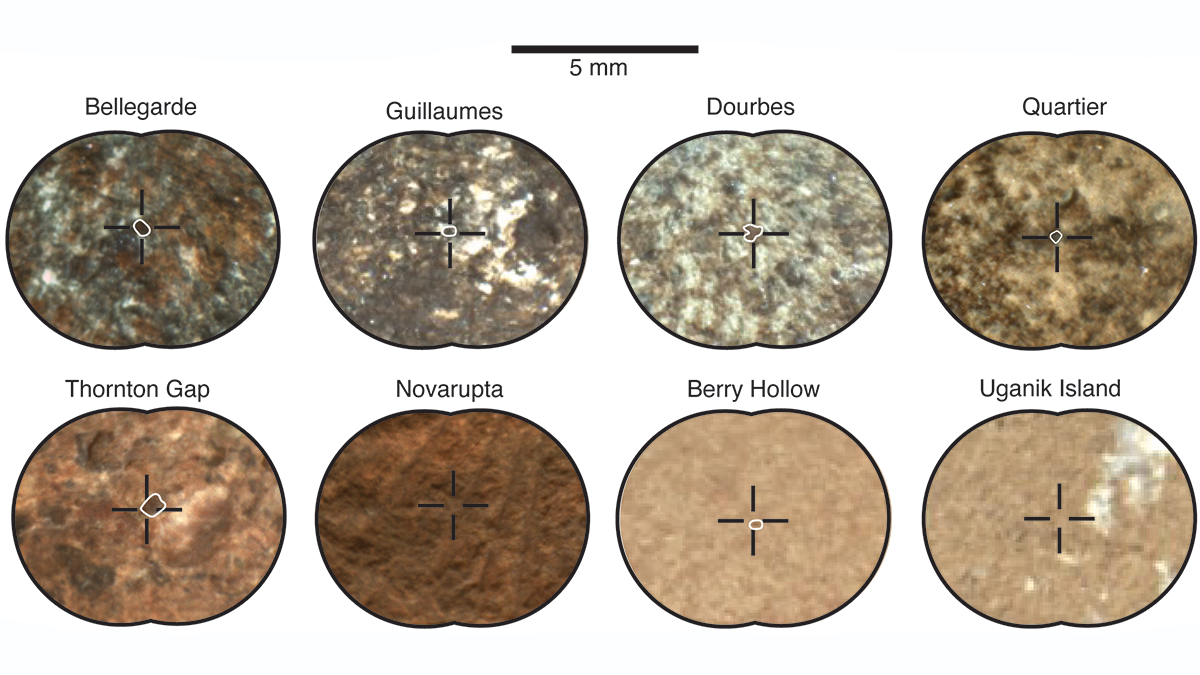
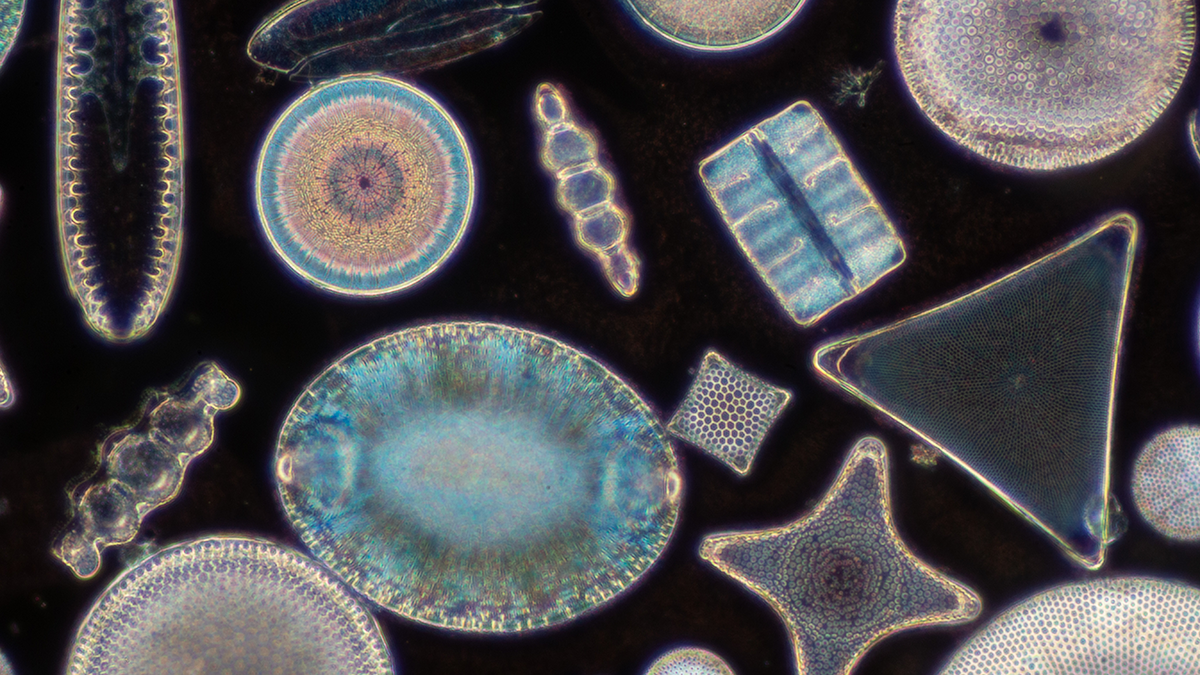
Machine Learning Enhances Image Analysis in Biogeosciences
Machine learning can enhance our ability to identify communities of microorganisms and how they change in response to climate change over time.

Posted inEditors' Highlights
How Does Subsurface Lithology Speak to Hillslope Morphology?
Subsurface flow hydrology connects soils and bedrock lithology to long-term catchment evolution in humid landscapes.
Posted inEditors' Highlights
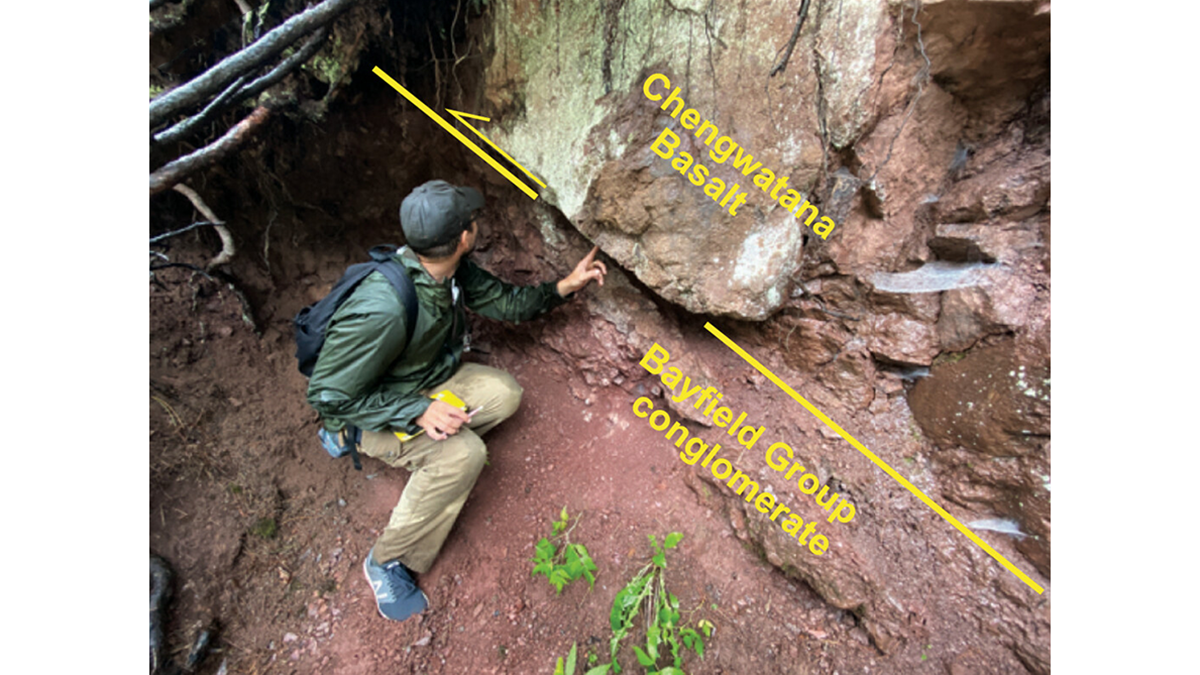
Structural Inversion of an Intracratonic Rift System in Deep Time
A new study reconstructs how an ancient North American rift system was uplifted in space and time due to subsequent continent-continent collision.

Posted inEditors' Highlights
Clumped CO Isotopes – New Tracers for Atmospheric Chemistry
A new study reports the first measurements of 13C18O in atmospheric carbon monoxide (CO) and show their variations reflect chemical ‘aging’ consistent with predicted kinetic isotope effects.

Posted inEditors' Highlights
Timing the Global Expansion on the Moon
A new analysis of the relation between randomly oriented linear gravity anomalies and two large craters on the Moon implies that the gravity anomalies formed over a long period of time.

Posted inEditors' Highlights
Seismotectonic Update of the Philippines-Taiwan Region
Using more than two decades of data, scientists find that the Philippine and Taiwan subduction region is controlled mainly by shallow seismicity and low magnitude earthquakes.