
State-of-the-art high-resolution models are needed to reveal the ocean’s role in driving extra-tropical weather systems.
Editors’ Highlights
Posted inEditors' Highlights
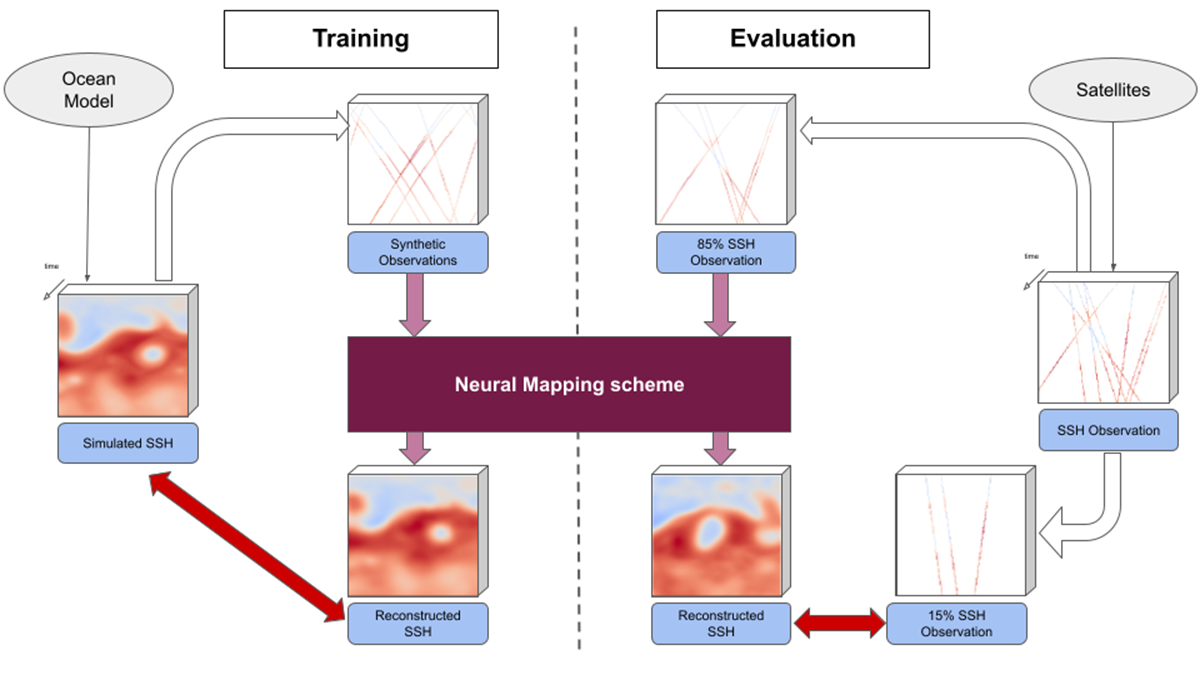
Physics + Machine Learning Provide a Better Map of Ocean Measurements
A new study offers a compelling example where the merger of dynamical modeling, machine learning, and ocean measurements enhances oceanographic understanding, monitoring, and mapping.

Posted inEditors' Highlights
The Invisible Hand of Carbon Dioxide on Forest Productivity
A statistically robust approach applied to long-term flux measurements quantifies forest ecosystem response to increasing atmospheric carbon dioxide, providing a valuable benchmark for climate models.

Posted inEditors' Highlights
Machine Learning Masters Weather Prediction
Community datasets and evaluation standards are needed to further advance machine learning for weather prediction.
Posted inEditors' Highlights
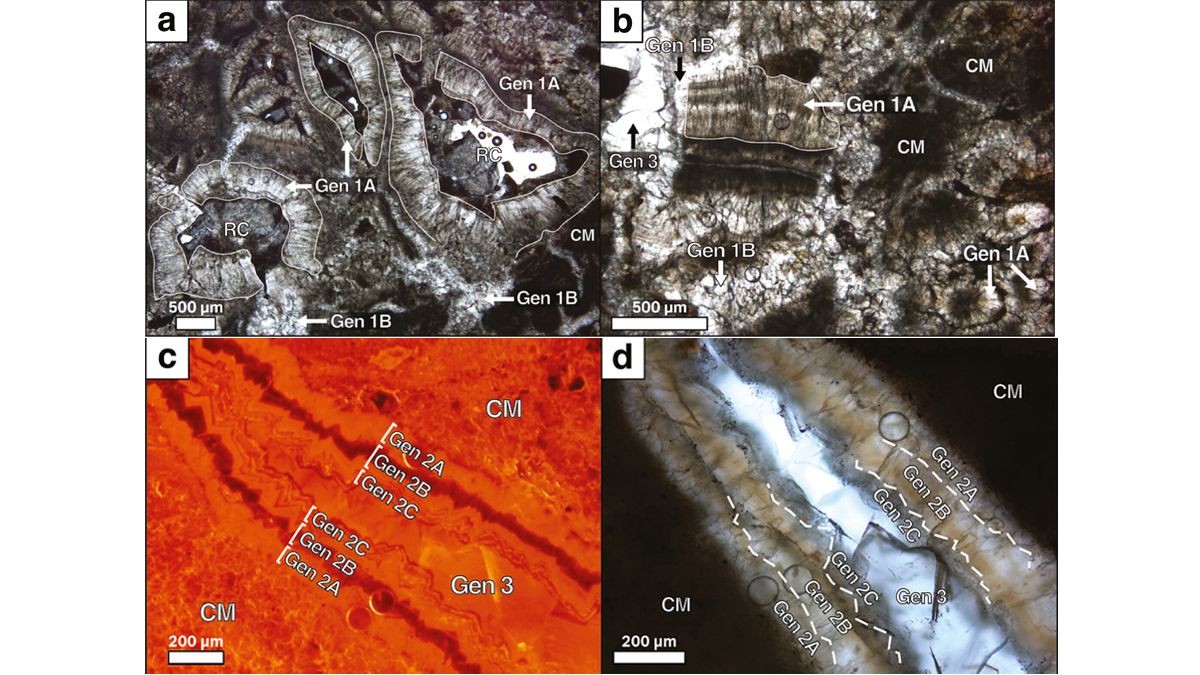
Unlocking Earth’s Terrestrial Sedimentary Record with Paleosols
Harnessing the micro-stratigraphy of pedogenic carbonates, scientists have demonstrated that age determination of fossil soils is possible via uranium-lead dating.
Posted inEditors' Highlights
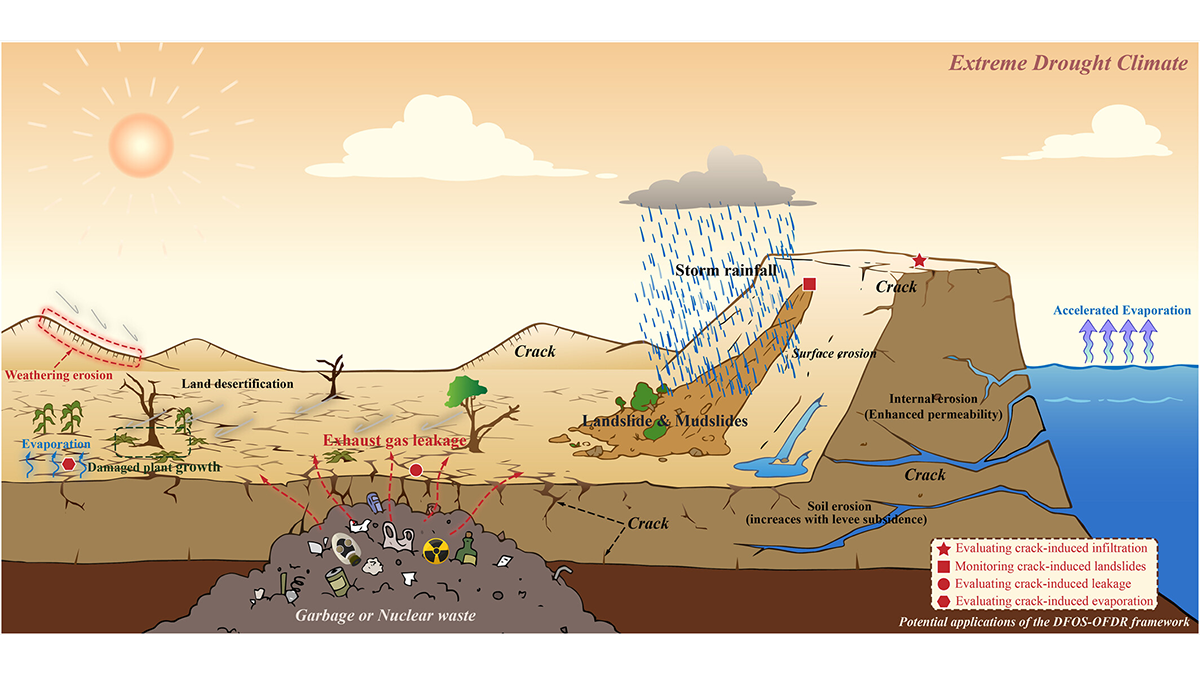
New Observations Provide Insight into Soil Desiccation Cracking
A new application of distributed fiber optic sensing provides early detection of soil desiccation cracking behavior and illustrates, for the first time, the phenomenon of soil crack breathing.

Posted inEditors' Highlights
Open-Source MAGPRIME Supports Space Magnetism in the Heliosphere
MAGPRIME is a library of magnetic interference removal algorithms, including benchmarks, that can aid in the design of spacecraft by providing simulations to determine optimal magnetometer placement.

Posted inEditors' Highlights
A Seismogenic Shear Zone Diagonal to the Main Himalayan Thrusts
Scientists document active seismic shear along a major lineament of Sikkim Himalaya diagonal to the Main Himalayan Thrusts.
Posted inEditors' Highlights
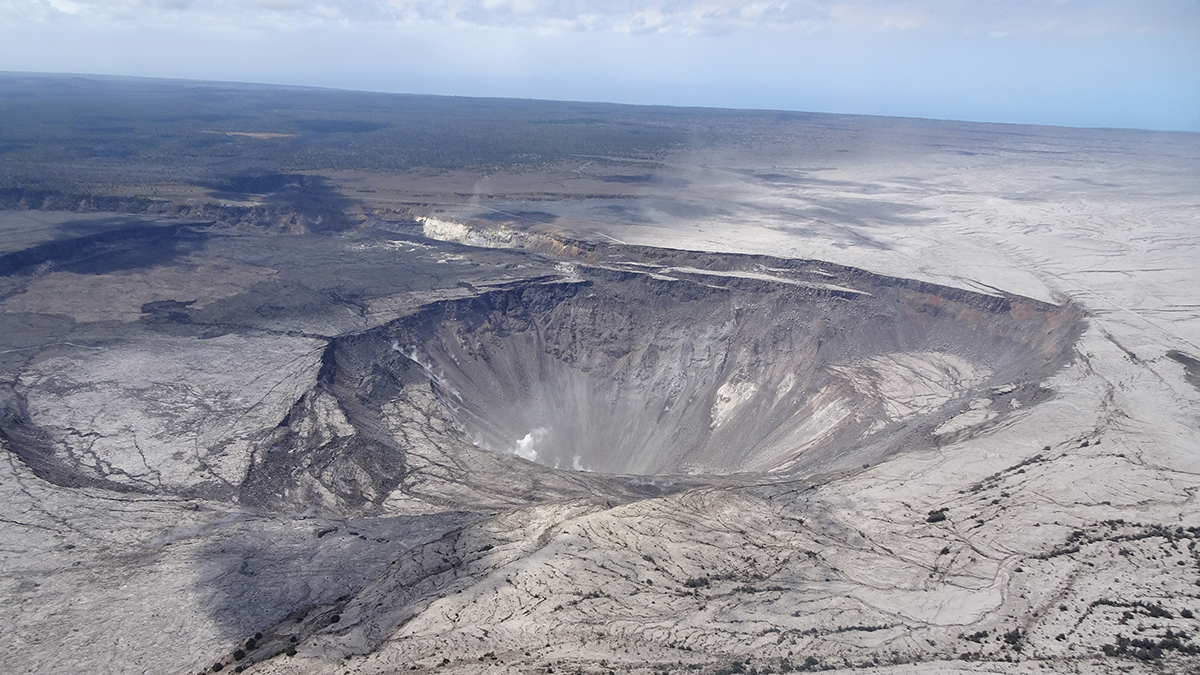
Caldera Collapse as a Natural Example of Rock Friction
Recurrent slips on the caldera wall of the Kīlauea Volcano are a natural experiment not only to understand the mechanics of caldera formation but also to gain more insights into fault friction.

Posted inEditors' Highlights
Dual Tsunami Generation from Atmospheric and Oceanic Sources
The 2022 Tonga volcanic eruption generated waves that propagated across the Pacific Ocean. A new analysis of sea level measurements is used to dissect the difference in wave components from two sources.