Editors’ Highlights are summaries of recent papers by AGU’s journal editors.
Source: AGU Advances
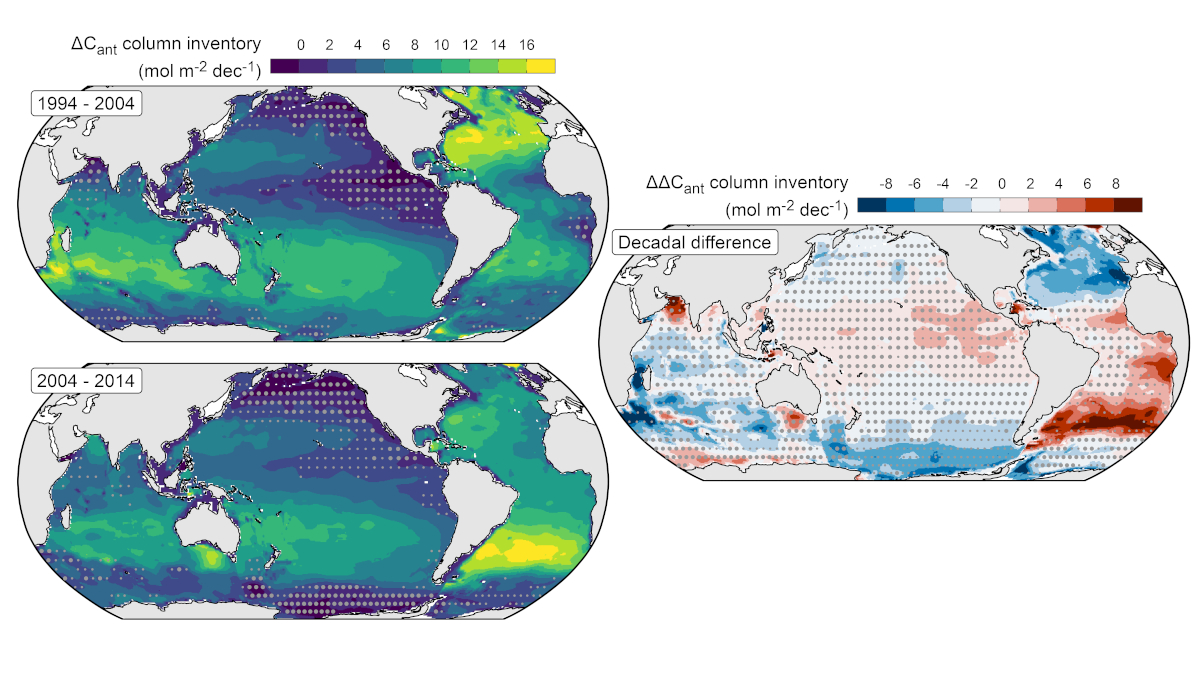
The trend of the global ocean sink for anthropogenic carbon dioxide (CO2) is a topic of current debate. Using three decades of observations of inorganic carbon in the ocean, Müller et al. [2023] find that ocean storage since 1994 grew at a constant rate of ~28 Pg carbon (C) per decade. However, greater increases in atmospheric CO2 from 2004 to 2014 indicate that ocean uptake in the recent decade was 15 ± 11% lower than expected based on the relationship between ocean uptake and atmospheric increase from 1994 to 2004. The authors attribute this to both a decrease in the ocean buffer capacity and changes in ocean circulation. The latter is also reflected in the decadal variability of accumulation patterns. Estimates of changes in ocean C storage were significantly greater than those derived from air-sea CO2 fluxes, suggesting changes in the ‘natural’ C inventory. These results emphasize the vulnerability of the ocean C sink to climate change.
Citation: Müller, J. D., Gruber, N., Carter, B., Feely, R., Ishii, M., Lange, N., et al. (2023). Decadal trends in the oceanic storage of anthropogenic carbon from 1994 to 2014. AGU Advances, 4, e2023AV000875. https://doi.org/10.1029/2023AV000875
—Susan Trumbore, Editor in Chief, AGU Advances