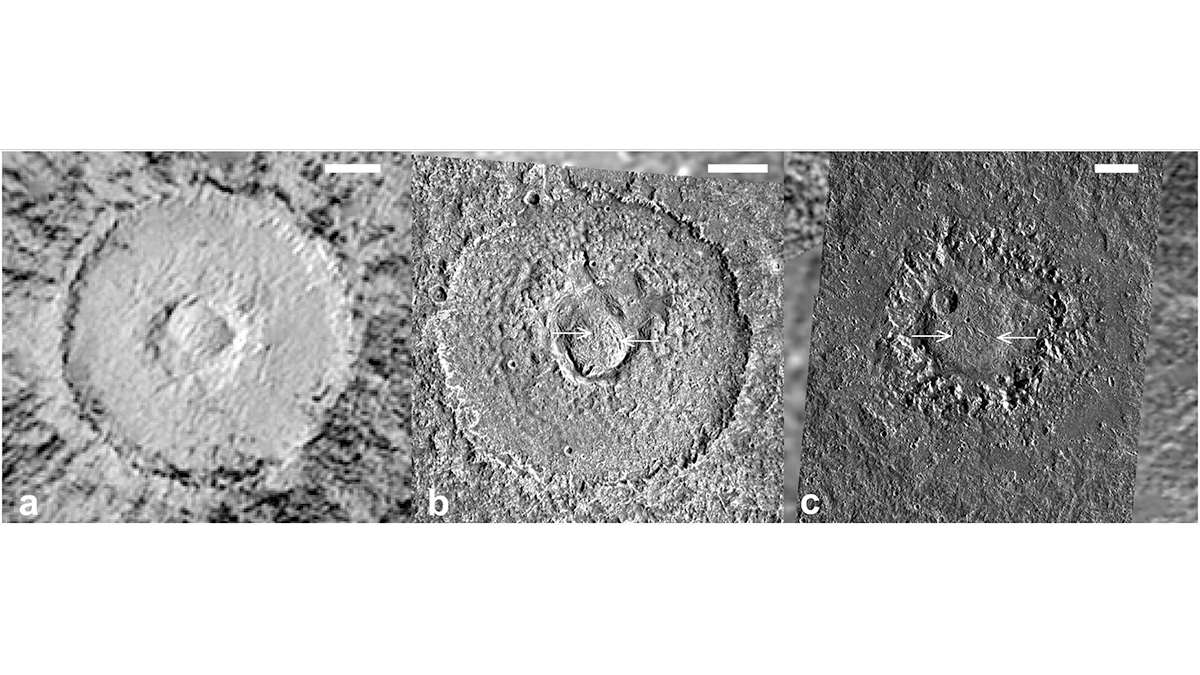
Large craters with broad central domes are a unique crater morphology on Jupiter’s largest icy moons: Ganymede and Callisto. A new study examines how remnant impact heat may lead to their formation.
Editors’ Highlights

Posted inEditors' Highlights
Faults Along Salt Walls Are Less Stressed in the Paradox Basin
Based on an extended stress database, scientists observe systematic changes in the tectonic stress state and a reduction in fault reactivation potential near salt walls in the Paradox Basin.
Posted inEditors' Highlights
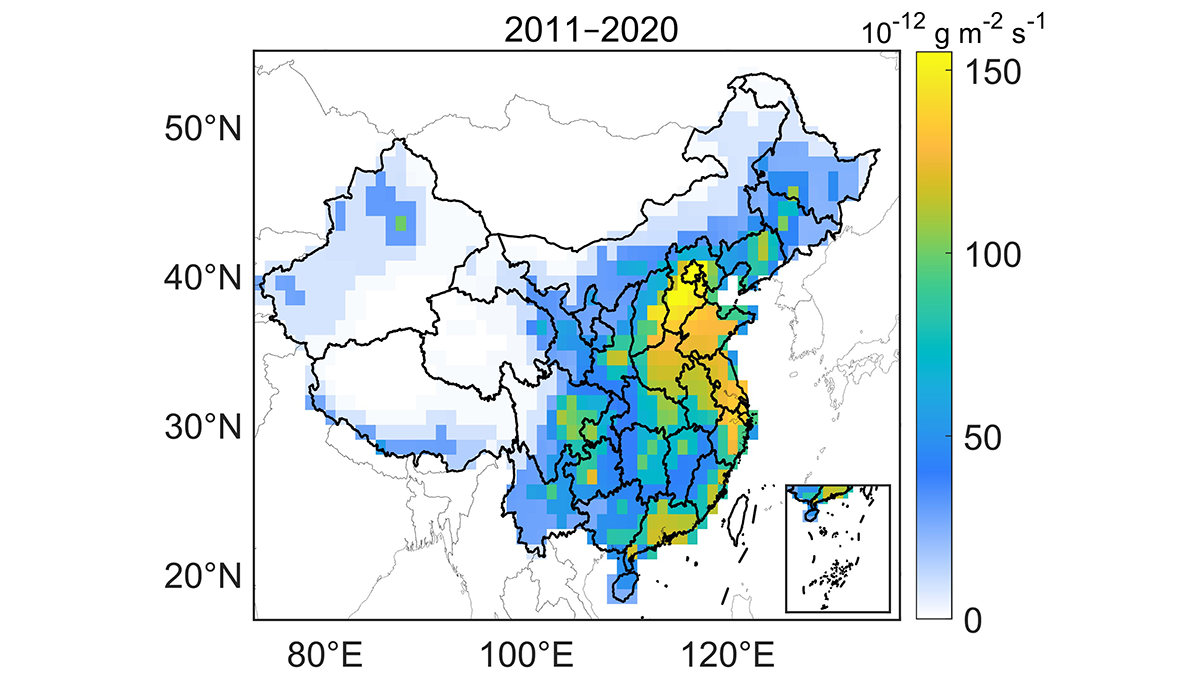
Need for Better Accounting of CFC-12 Emissions from China
New observations show that bottom-up tracking of CFC-12 emissions from China are underestimated, illustrating the need for better accounting for reductions from the Montreal Protocol.

Posted inEditors' Highlights
Publishing is Stressful: What Can We Do About It?
AGU’s editors address how rapidly evolving expectations, the culture of metrics, and the expansion of for-profit journals stress authors, reviewers and editors – and how to change this dynamic.

Posted inEditors' Highlights
Ocean Impacts on European Winter Weather
State-of-the-art high-resolution models are needed to reveal the ocean’s role in driving extra-tropical weather systems.
Posted inEditors' Highlights
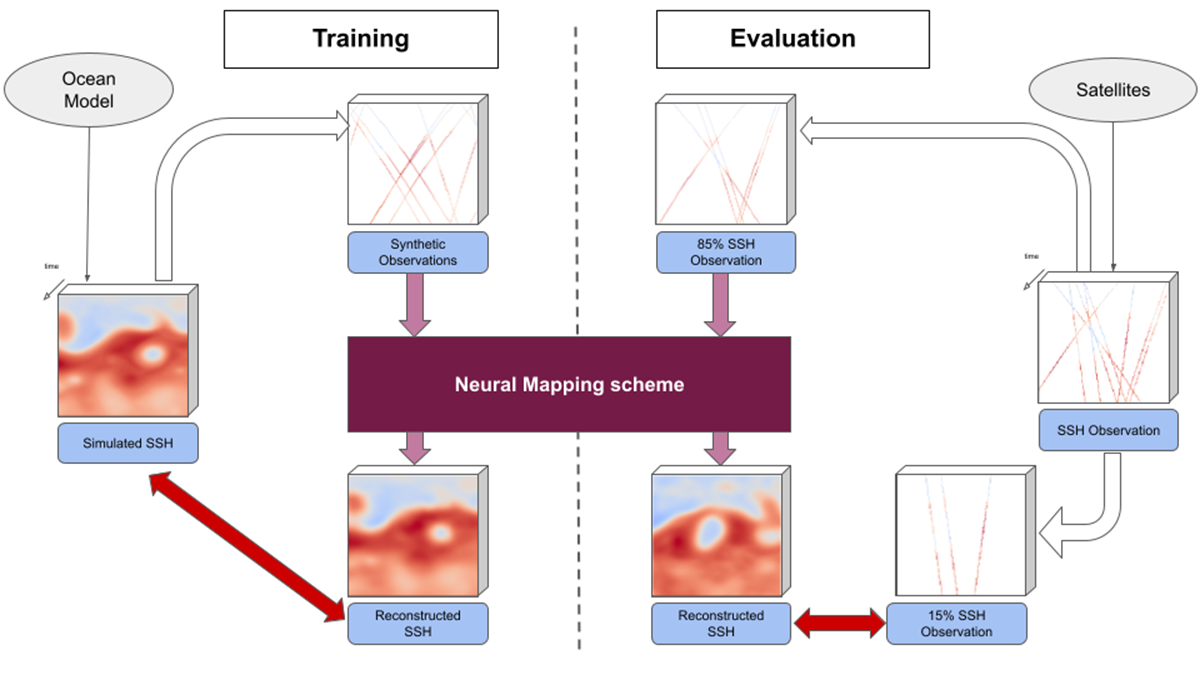
Physics + Machine Learning Provide a Better Map of Ocean Measurements
A new study offers a compelling example where the merger of dynamical modeling, machine learning, and ocean measurements enhances oceanographic understanding, monitoring, and mapping.

Posted inEditors' Highlights
The Invisible Hand of Carbon Dioxide on Forest Productivity
A statistically robust approach applied to long-term flux measurements quantifies forest ecosystem response to increasing atmospheric carbon dioxide, providing a valuable benchmark for climate models.

Posted inEditors' Highlights
Machine Learning Masters Weather Prediction
Community datasets and evaluation standards are needed to further advance machine learning for weather prediction.
Posted inEditors' Highlights
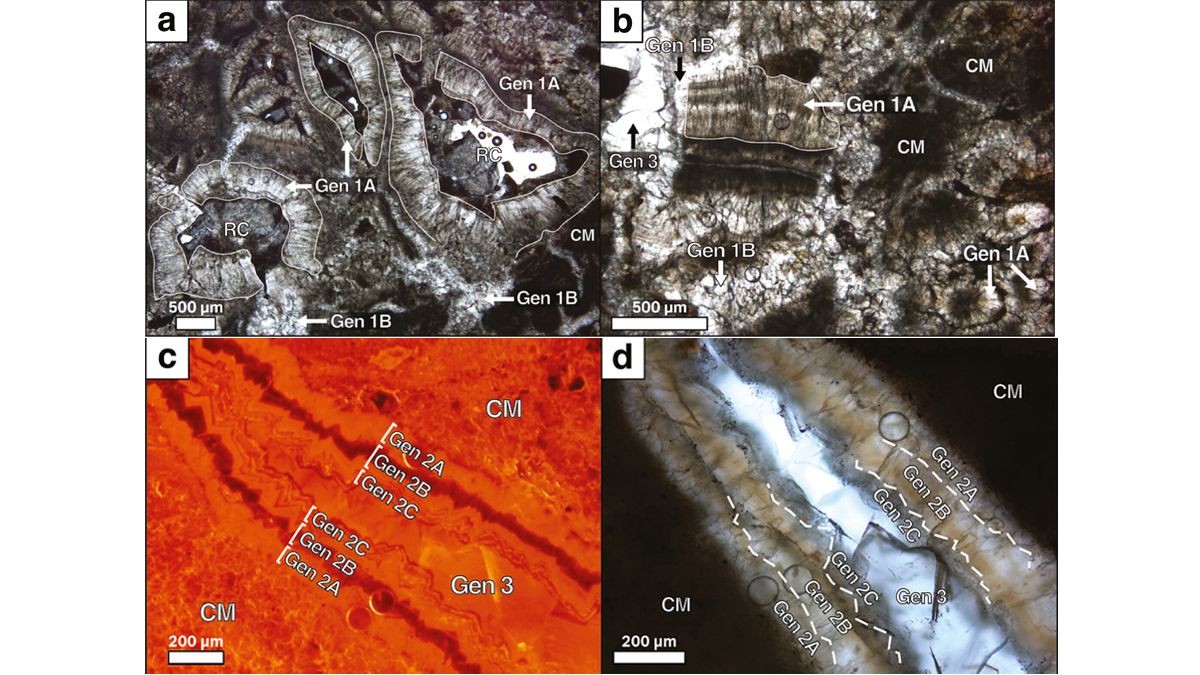
Unlocking Earth’s Terrestrial Sedimentary Record with Paleosols
Harnessing the micro-stratigraphy of pedogenic carbonates, scientists have demonstrated that age determination of fossil soils is possible via uranium-lead dating.
Posted inEditors' Highlights
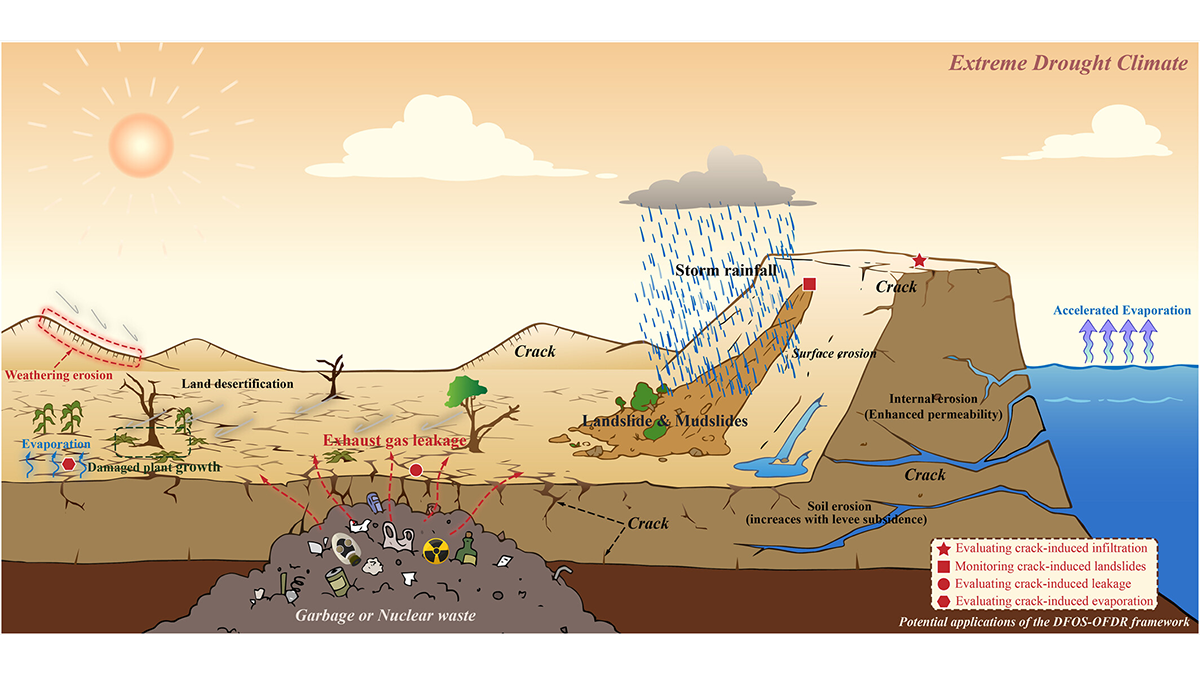
New Observations Provide Insight into Soil Desiccation Cracking
A new application of distributed fiber optic sensing provides early detection of soil desiccation cracking behavior and illustrates, for the first time, the phenomenon of soil crack breathing.