
Long-persistent stable cratons bear much of the deep-time geologic record, and a new study combines seismic and petrological data to reveal how interactions with mantle fluids can shape their evolution.
Editors’ Highlights

Posted inEditors' Highlights
Nutrients at Depth Can Be Uplifted by the Kuroshio Large Meander
Aperiodic, southward deflection of the Kuroshio, a.k.a. the Kuroshio large meander, uplifts the nutrients in deep layers to induce offshore phytoplankton bloom.
Posted inEditors' Highlights
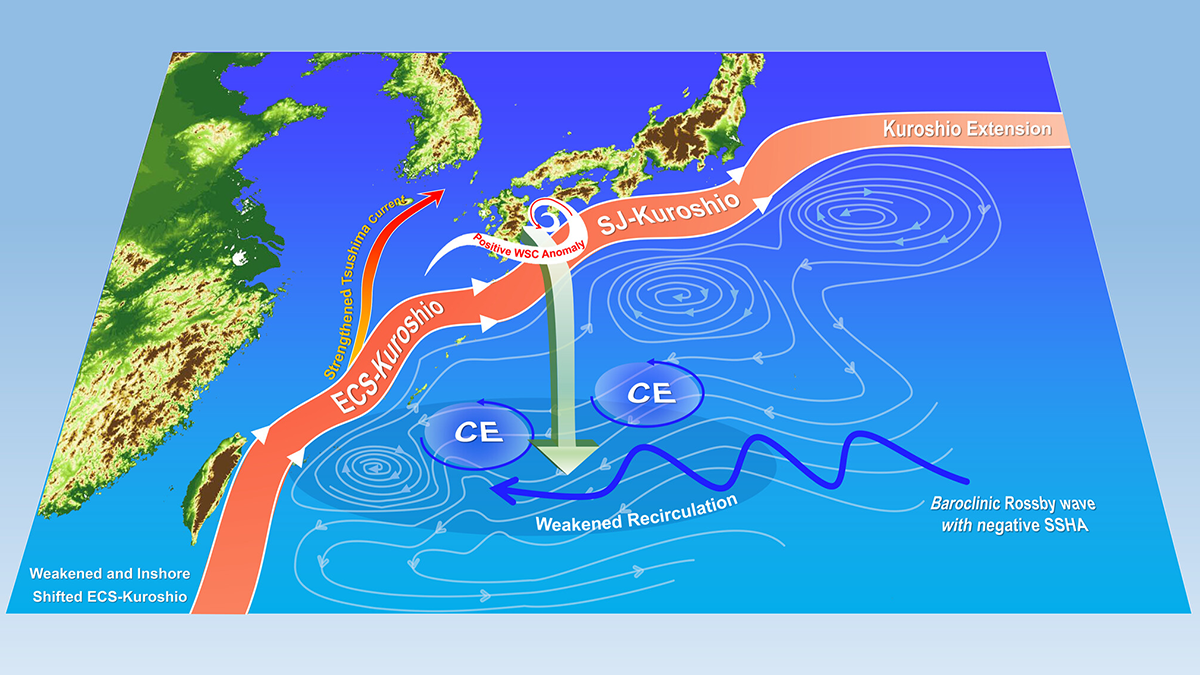
ENSO Variations Modulate the Kuroshio in the East China Sea
Recent warm El Niño Southern Oscillation events strengthened winds over the western Subtropical North Pacific, leading to planetary waves with cyclonic eddies, weakening the Kuroshio in the East China Sea.

Posted inEditors' Highlights
Urban Greening Could Help Achieve Carbon Neutrality Goals
A new modeling framework highlights that urban greening is a sustainable solution to achieve environmental co-benefits in mitigating heat and carbon emissions.
Posted inEditors' Highlights
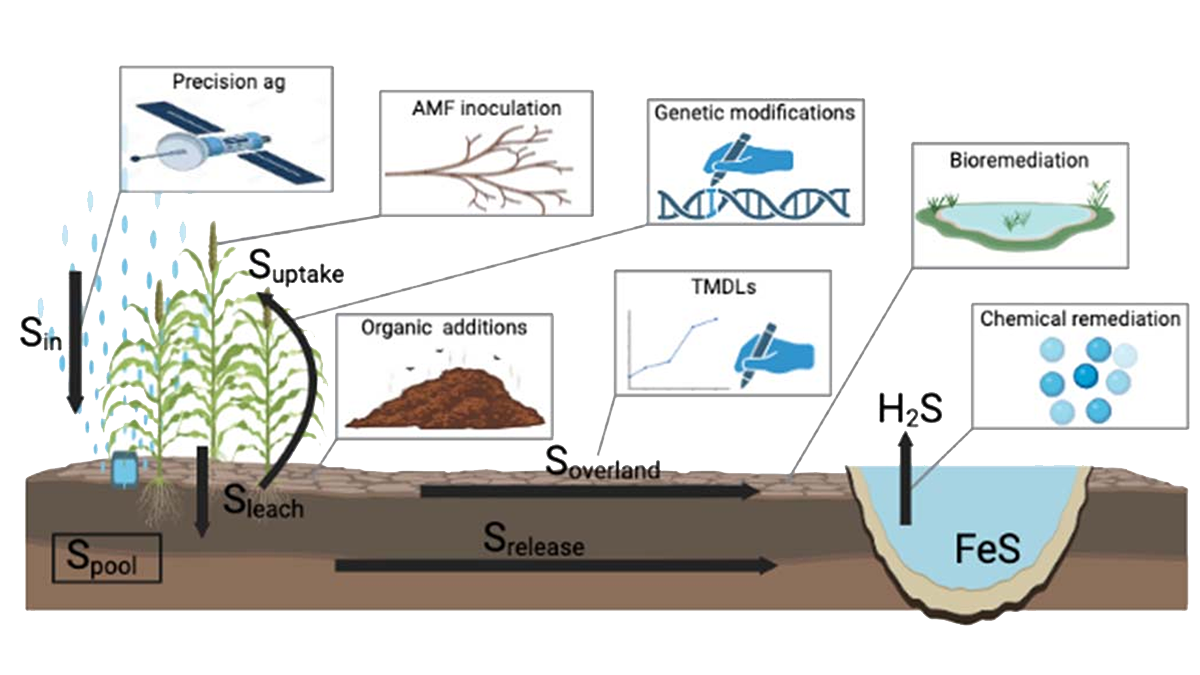
Sulfur is Demanding its Place in Crop Nutrient Budgeting
Scientists advocate for a more significant consideration of sulfur from a multidisciplinary perspective as a necessary step towards sustainable crop management.
Posted inEditors' Highlights
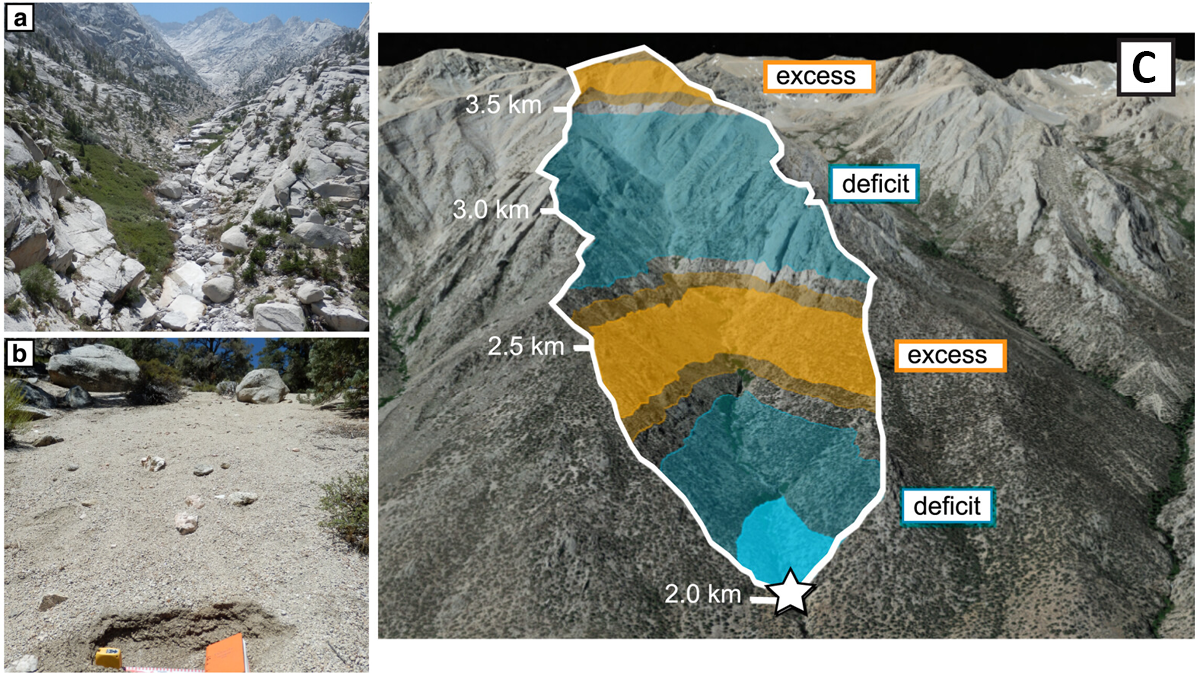
Revealing a Catchment’s Erosional Secrets: Grain Size Matters
A provenance study with 699 new samples from 12 different sediment grain sizes (from sand to boulder) shows that each fraction originates from distinct parts of a mountain catchment in California.

Posted inEditors' Highlights
A Crystal Ball for the Carbon Cycle, But a Cloudy One
Carbon cycle models quantify relationships between emission scenarios and resulting atmospheric concentrations, but are the projections credible? New analyses find grounds for both hope and concern.
Posted inEditors' Highlights
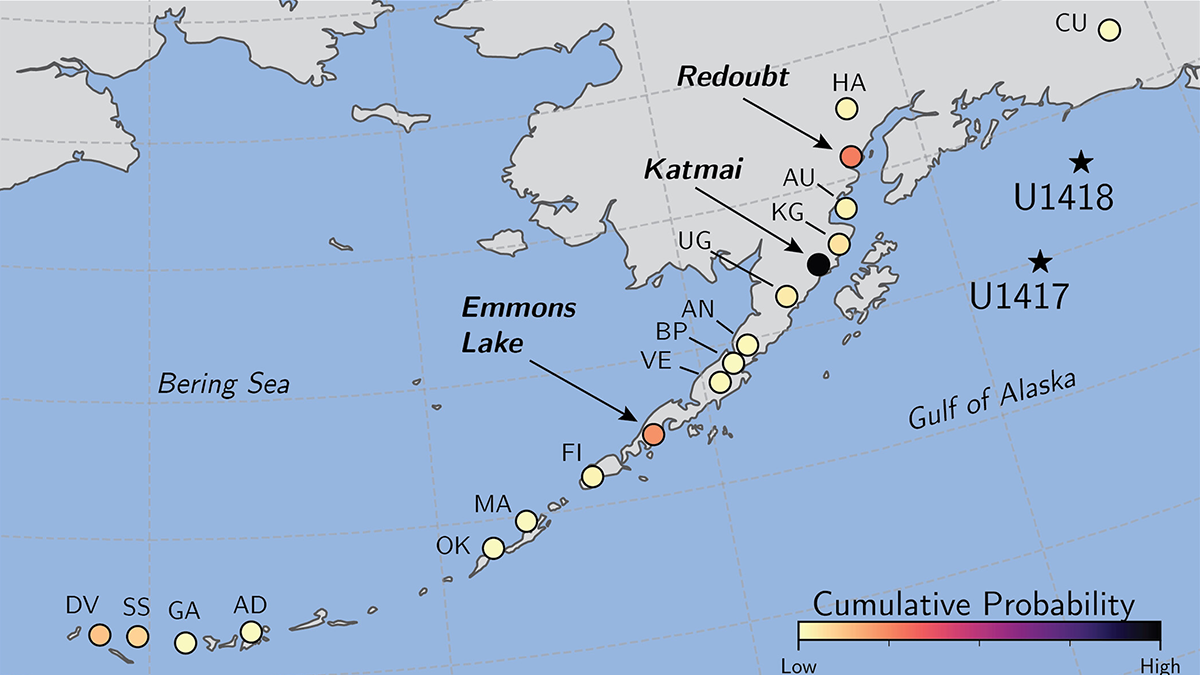
Machine Learning Identifies Source Volcanoes of Ash Deposits
Tracing ash layers from explosive eruptions back to their source volcanoes is needed to evaluate hazards to population and aviation, a problem addressed by a new machine learning classification method.
Posted inEditors' Highlights
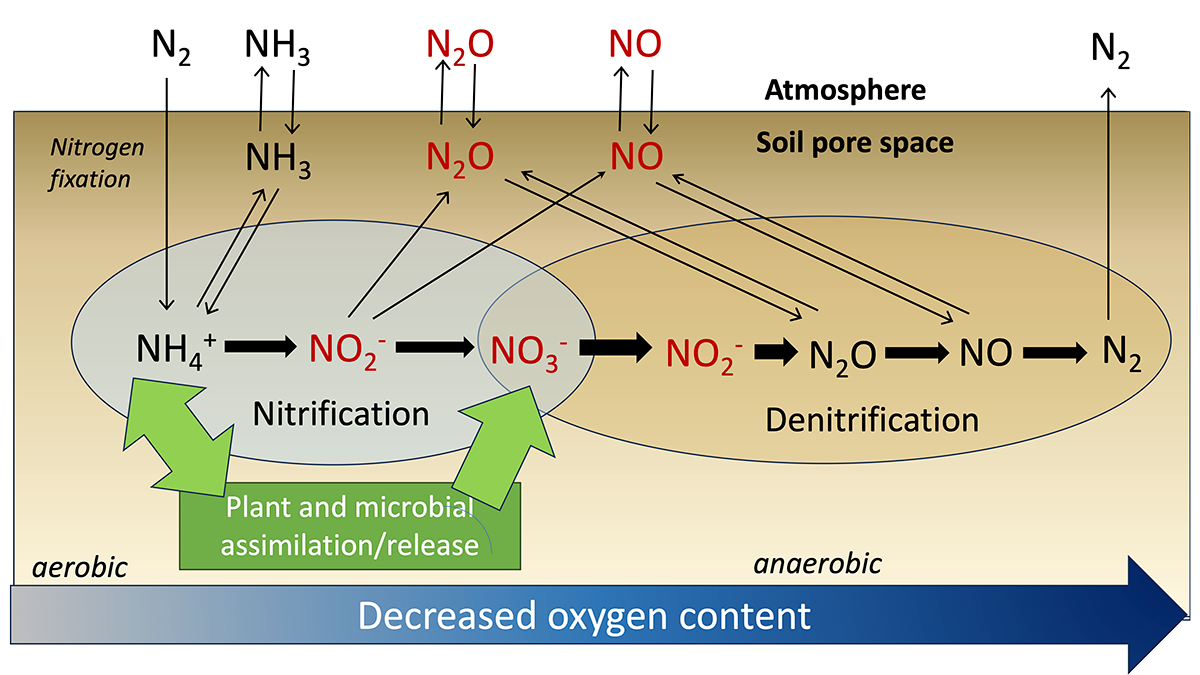
Reporting Model Results Even When They Cannot (Yet) be Tested
Models simulating the nitrogen cycle track its multiple chemical forms but tend to report a subset that can be compared with available field measurements.

Posted inEditors' Highlights
Cumulus Cloud Botany in Large Domains
A new study provides a sample of shallow cumulus clouds simulated in domains 150-kilometers wide, enabling investigations of their structure and organization.