Editors’ Highlights are summaries of recent papers by AGU’s journal editors.
Source: Journal of Geophysical Research: Atmospheres
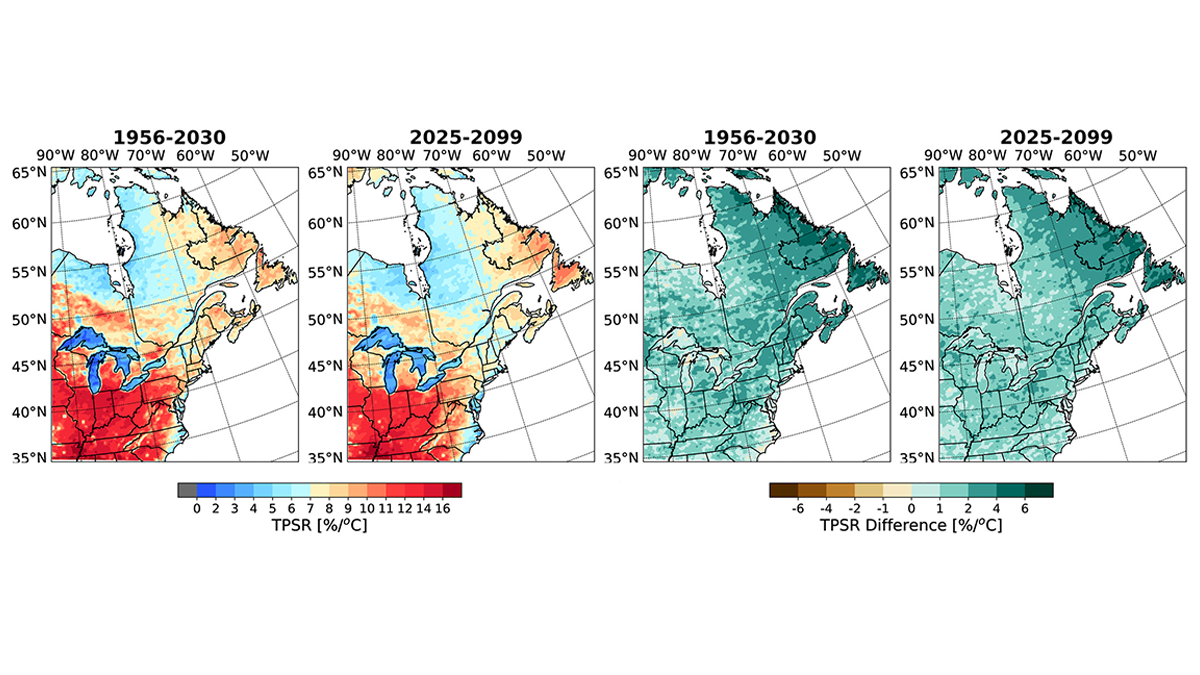
In a future climate, precipitation is expected to be around 7% more intense for each Celsius-degree temperature increment. This estimation is based on a thermodynamic relationship described by the Clausius-Clapeyron equation. However, the temperature-precipitation scaling rate is known to deviate for extreme precipitation.
Pérez Bello et al. [2022] use a duration-based classification of the extreme rainfall events to analyze this rate. By using an ensemble of 50-member climate simulations, they find that in northeastern North America the peak value and the total rainfall depth of the rainfall events respond differently to temperature. Values above the Clausius-Clapeyron relation were observed in the southern regions for most of the ranges of rainfall durations analyzed. The authors also find that in a future climate, the more extreme one-hour annual maximums will be embedded in shorter and likely more convective dominant rainfall events.
Citation: Pérez Bello, A., Mailhot, A., Paquin, D., & Paquin-Ricard, D. (2022). Temperature-precipitation scaling rates: A rainfall event-based perspective. Journal of Geophysical Research: Atmospheres, 127, e2022JD037873. https://doi.org/10.1029/2022JD037873
—Minghua Zhang, outgoing Editor in Chief, JGR: Atmospheres