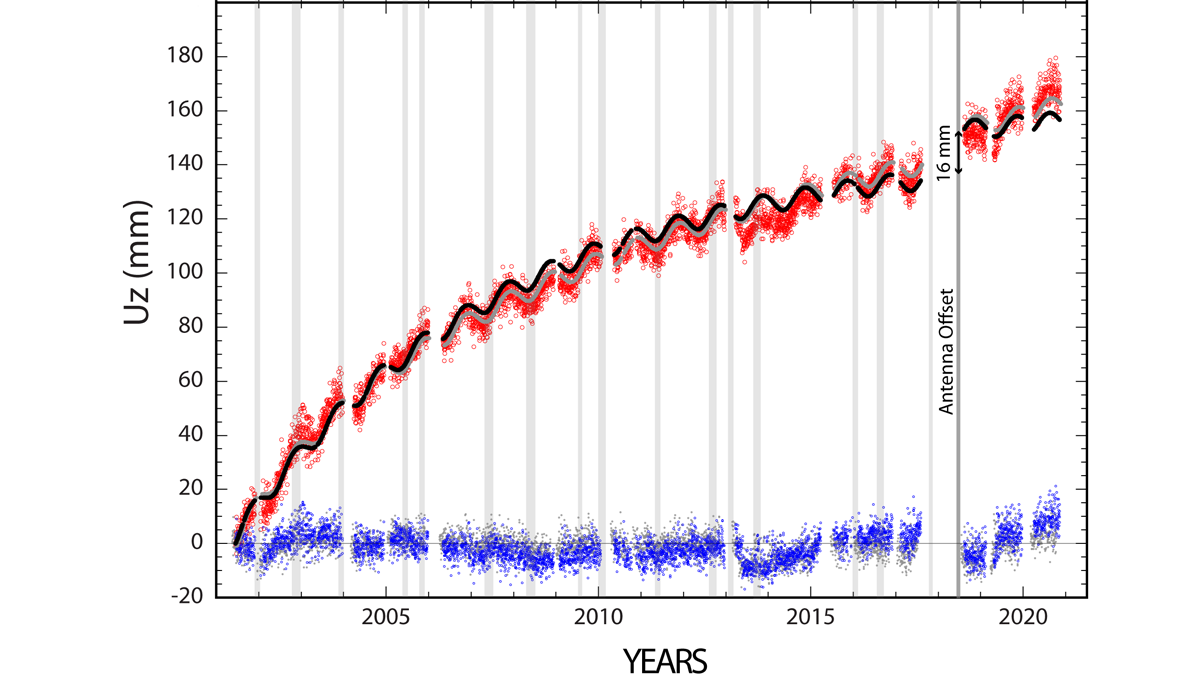
Geodetic measurements indicate that Three Sisters Volcano uplifted by almost 300 millimeters in the past 25 years without significant anomalies at the surface.
Editors’ Highlights

Posted inEditors' Highlights
Clay Type, Not Just Content, Crucial for Fault Zone Permeability
Faults containing clays are often considered as barriers to fluid flow but new work shows that fault processes leading to the formation of clays can increase permeability relative to the host rock.
Posted inEditors' Highlights
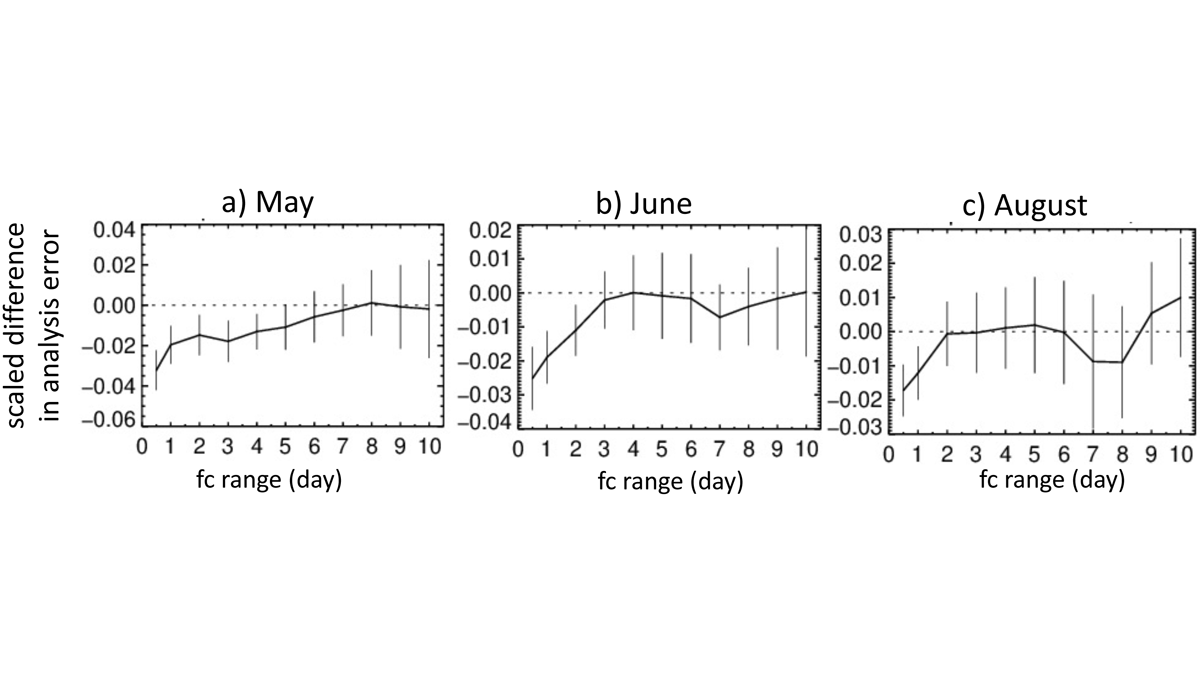
Impact of Assimilating Aeolus Winds on Kelvin Waves
Assimilation of Aeolus winds in the ECMWF analyses and forecasts improves the Kelvin Waves representation and forecasts in the tropical tropopause layer.
Posted inEditors' Highlights
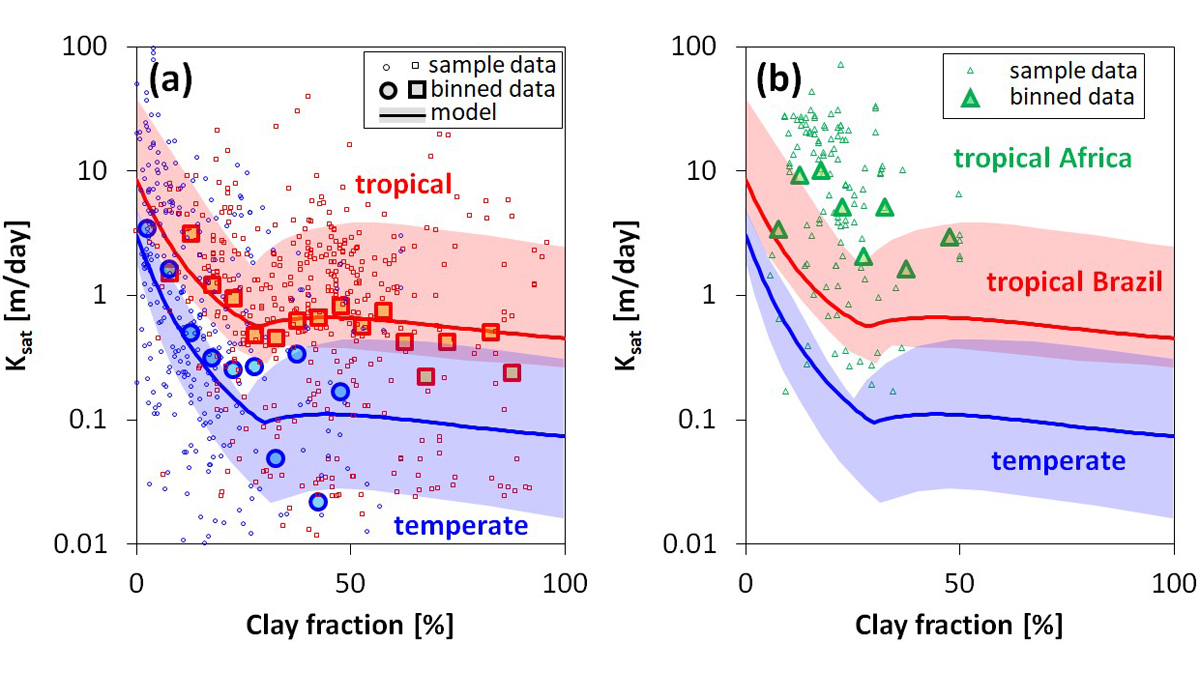
Not All Clays are Made Equal – and it Matters for Hydrology
Soil clay content is an important characteristic that affects many hydraulic and mechanical properties of soil; clay mineral type is important for their prediction.
Posted inEditors' Highlights
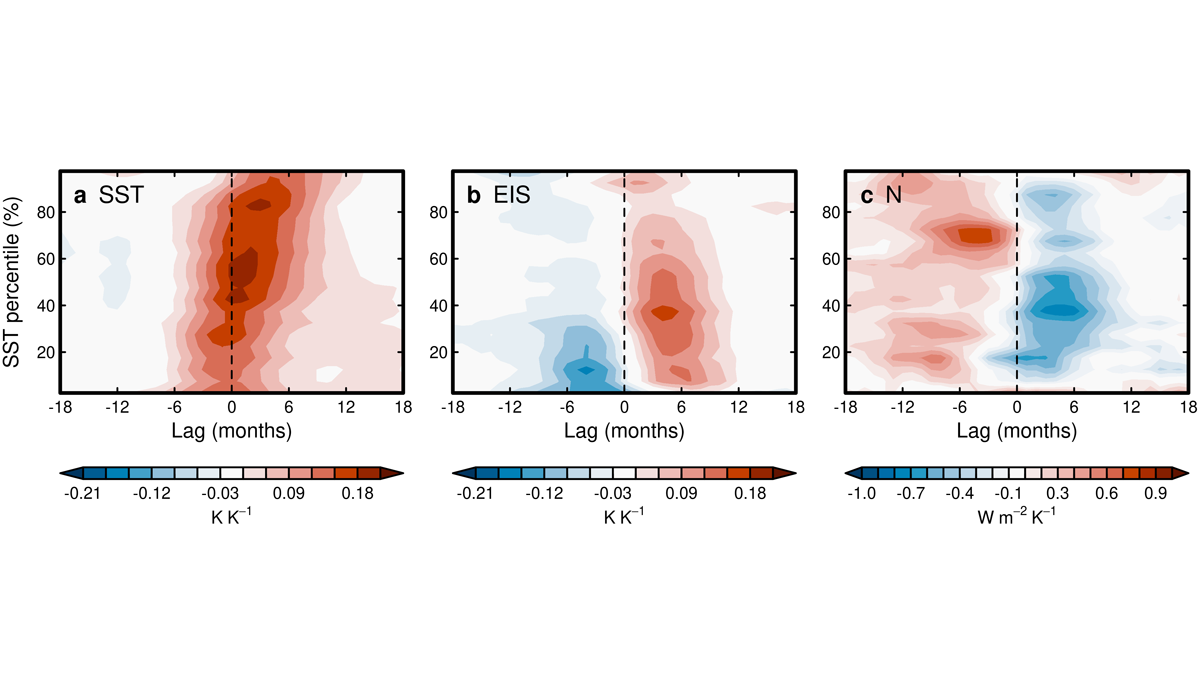
El Niño-Southern Oscillation and Radiation Two-Way Coupling
Changes in sea surface temperature during ENSO events and radiation are related, suggesting a two-way coupling between sea surface temperature and radiation in coupled climate variability.

Posted inEditors' Highlights
Evolution is More Important than Environment for Water Uptake
Despite conventional assumptions, a new study shows that evolutionary proximity of species defines root water uptake strategies, not their position in landscape or ambient environment.
Posted inEditors' Highlights
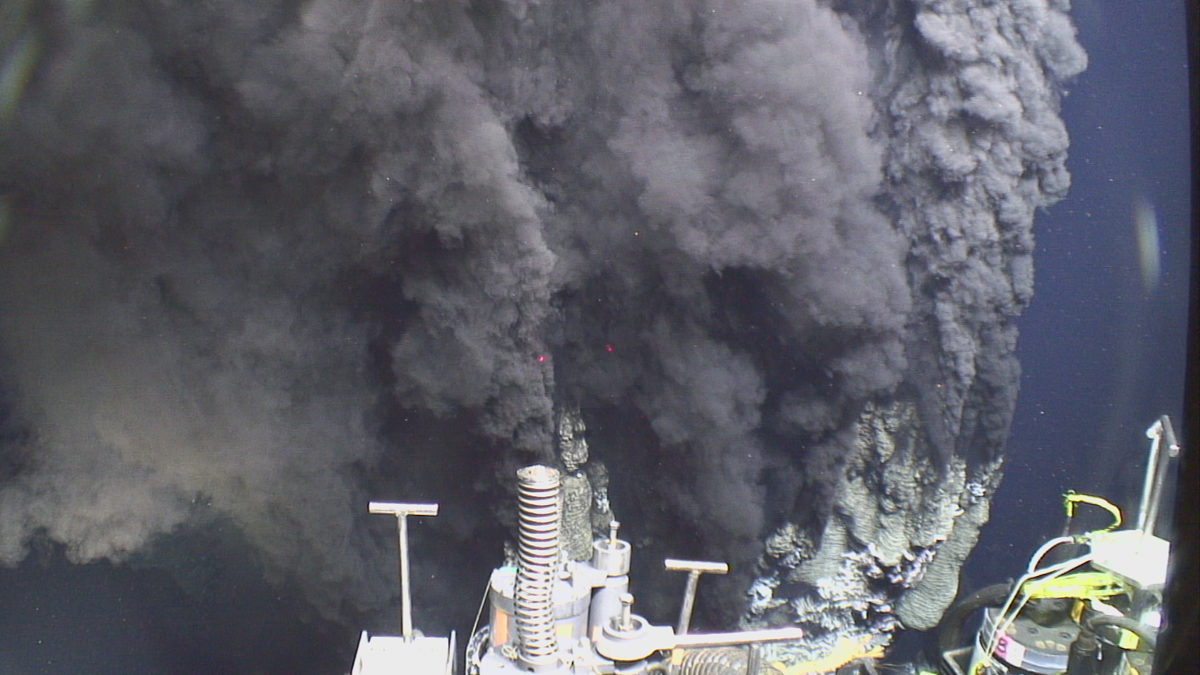
Bubble, Bubble, Toil and Trouble: Ocean Vents Spew Rubble
Hydrothermal vents in the ocean emit 6000-year-old carbon. The likely source? Ocean crust.

Posted inEditors' Highlights
Can Aurora Enhance Radar Monitoring of Arctic Aviation?
Enhanced E-region ionization produced by the aurora can be used to reflect signals from over-the-horizon radars and thus enable those radars to better monitor aviation in Arctic regions.

Posted inEditors' Highlights
What Conditions Accompanied the Late Ordovician Mass Extinction?
The second-largest mass extinction in Earth’s history took place in a period of stresses from non-sulfidic anoxia in shelf areas, together with glacioeustatic sea-level change and climatic cooling.
Posted inEditors' Highlights
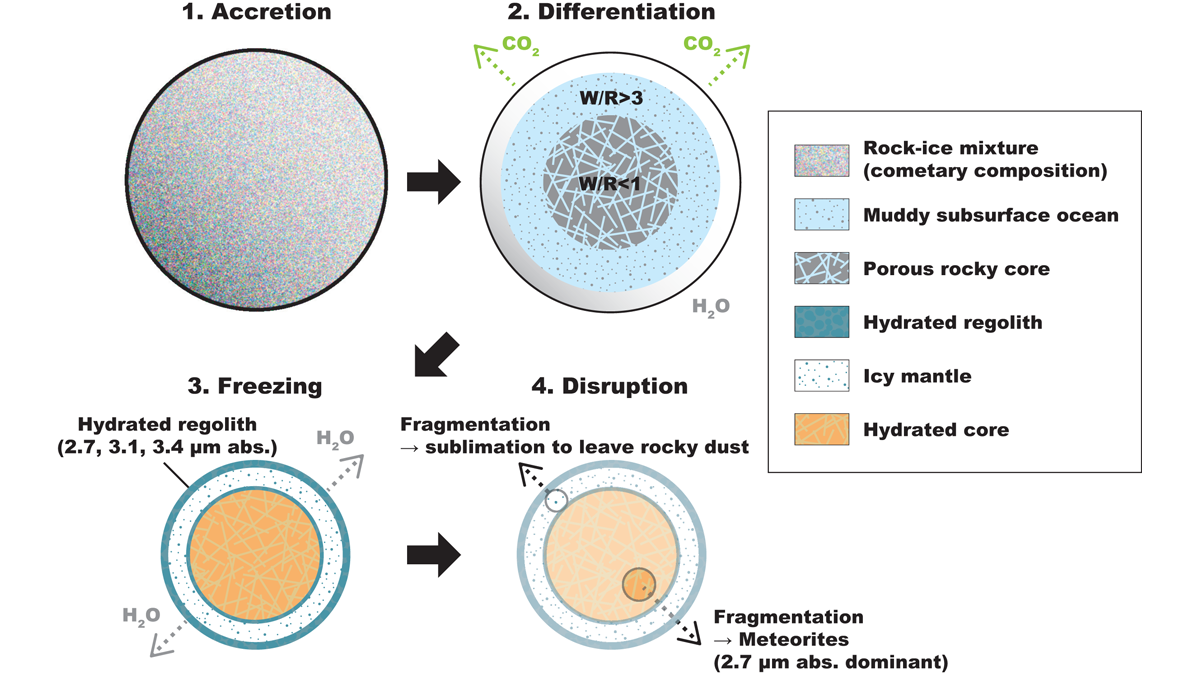
A Deep-Space Origin for Volatile-Rich Asteroids
Spectral data and modeling suggest that volatile-rich main-belt asteroids initially formed at much greater distances from the Sun (>10 AU).