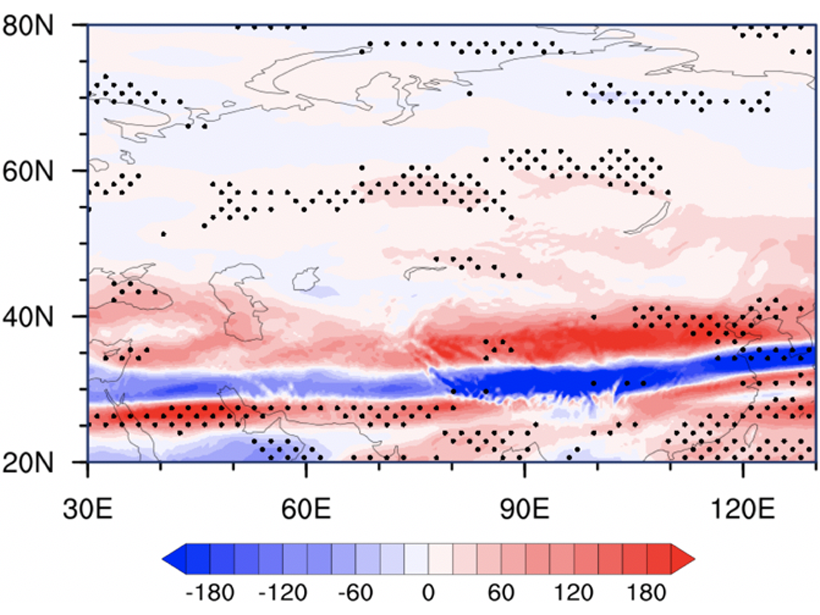
A significant increasing trend of turbulence in upper atmosphere over northern Eurasia is attributed to intense anthropogenic activities.
Editors’ Highlights

Posted inEditors' Highlights
Robot Measures Air-Sea Carbon Dioxide Exchange in Southern Ocean
Unique air and ocean surface observations of the Southern Ocean from a 22,000 km, 196-day circumnavigation around Antarctica by an Uncrewed Surface Vehicle.
Posted inEditors' Highlights
Why are Earthquakes on the San Andreas Seasonally Modulated?
There is growing evidence that some earthquakes occur seasonally but also that water loading cannot explain these observations.

Posted inEditors' Highlights
Wind Stress is not the Ceiling of Momentum Flux to the Ocean
The ocean is mainly driven by wind stress, but simultaneous observations show that the gain of momentum flux by the ocean can be larger than the wind stress due to the influence of ocean waves.
Posted inEditors' Highlights
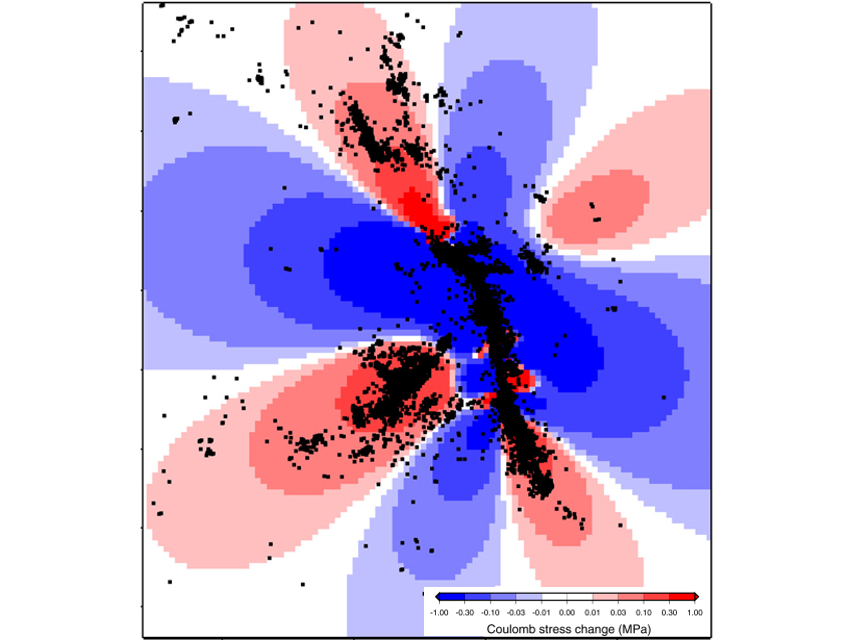
The Failure of Physics-Based Earthquake Forecasting Models
Spatial clustering of aftershocks explains why simple statistical models often outperform complex physics‐based earthquake forecasting models even if the physical mechanisms are correctly modeled.
Posted inEditors' Highlights
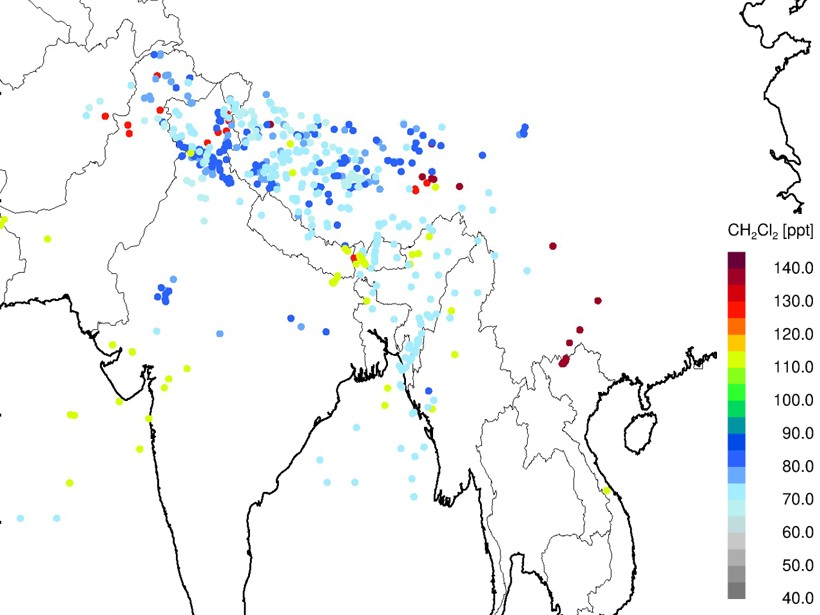
Measurements of Ozone-Depleting Chemicals in the Asian Monsoon
New high-altitude aircraft observations identify unexpected high levels of halogen-containing species entering the stratosphere above the summertime Asian monsoon.
Posted inEditors' Highlights
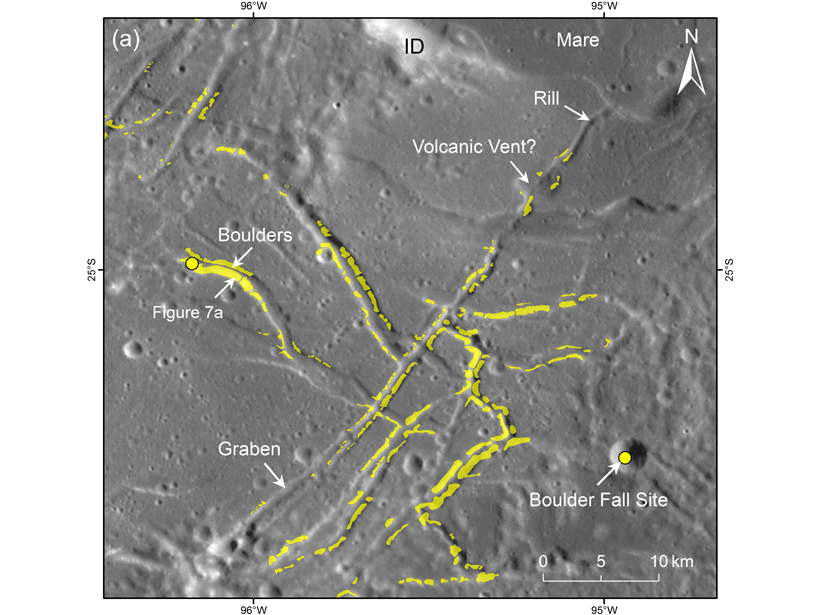
The Tumbling Boulders of Orientale Basin
Mapping boulder fields and boulder tracks highlights the seismic hazard still present on the Moon.
Posted inEditors' Highlights
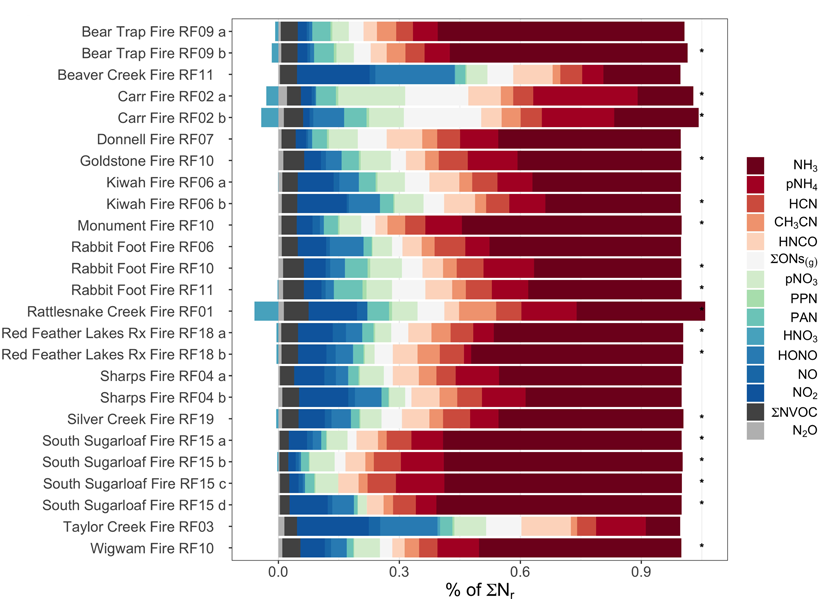
Deciphering Reactive Nitrogen Emissions from Wildfire Smoke
In-situ data gathered from an aircraft flying over 23 western US wildfires in 2018 reveal the importance of reduced nitrogen, shedding insights on ozone and aerosol formation from wildfires.
Posted inEditors' Highlights
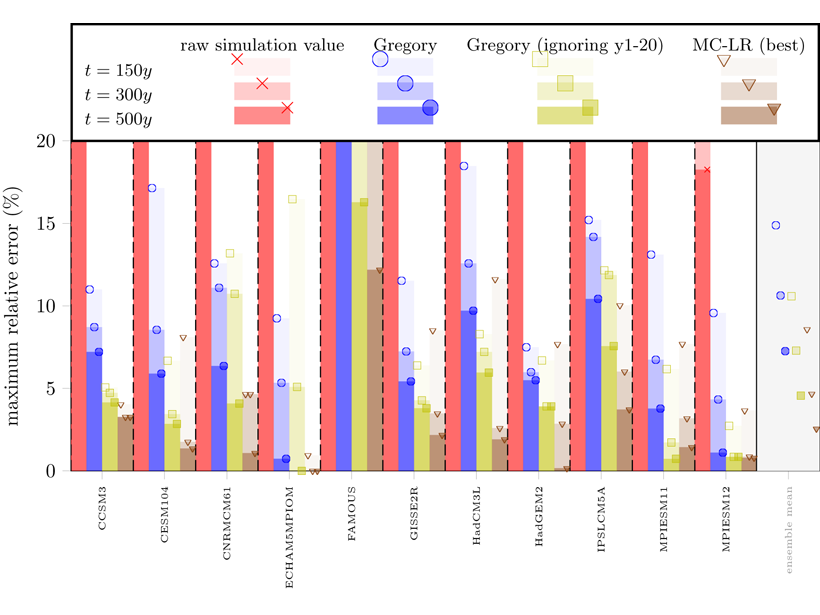
New Technique to Estimate Climate Sensitivity
Climate sensitivity can be estimated using multiple variables jointly in a multi-component linear regression.

Posted inEditors' Highlights
Devastation of Hurricane Maria to Puerto Rican Landscape
The destructive winds and rain of Hurricane Maria in 2017 caused a dramatic transformation to Puerto Rico’s landscape and altered the characteristics of land-air interaction.