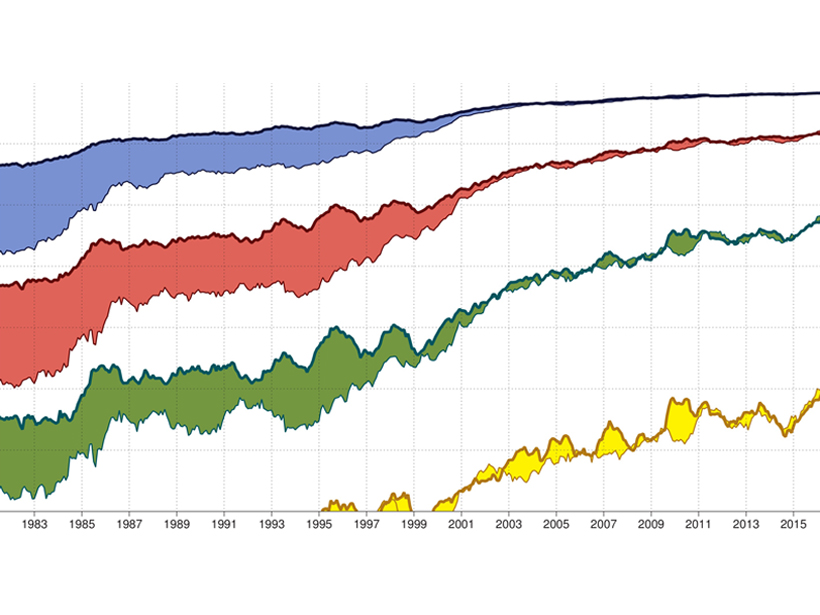
Source: Space Weather
Tools previously developed to assess and improve the value of terrestrial weather forecasts are now being used to advance space weather forecasting. Henley and Pope [2017] discuss these tools, including both techniques to quantify forecast uncertainties and methods to customize forecasts so that they can be well-integrated with how each user manages their specific risks. In particular, they highlight the technique of cost-loss analysis, which provides a way to assess the benefits of different user actions to mitigate risks in response to a forecast of that risk. This is a very readable introduction to the technique and discusses its application in a recent paper by Owens and Riley [2017]. It also discusses the potential for wider application to space weather of metrics developed by the global weather forecasting community, and the importance of those metrics being common standards used by all forecast centers.
Citation: Henley, E. M., & Pope, E. C. D. [2017]. Cost-loss analysis of ensemble solar wind forecasting: Space weather use of terrestrial weather tools. Space Weather, 15. https://doi.org/10.1002/2017SW001758
—Michael Hapgood, Editor, Space Weather
Text © 2018. The authors. CC BY-NC-ND 3.0
Except where otherwise noted, images are subject to copyright. Any reuse without express permission from the copyright owner is prohibited.

