Editors’ Highlights are summaries of recent papers by AGU’s journal editors.
Source: Earth and Space Science
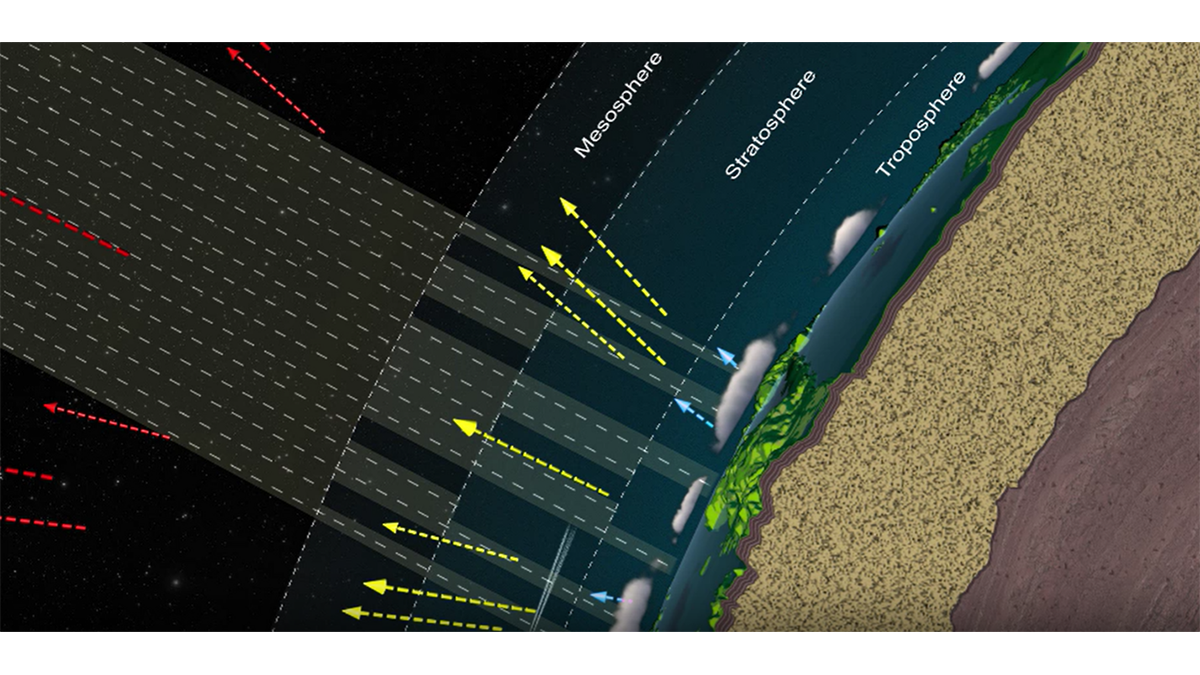
In a new study, Coddington et al. [2023] present an incremental update to the Total and Spectral Solar Irradiance Sensor-1 Hybrid Solar Reference Spectrum (TSIS-1 HSRS), which was originally released in 2021. Version 2 corrects the radiometric baseline between 0.202 and 0.210 micrometers (μm) and updates the solar lines at wavelengths longward of 0.743 μm. The HSRS Extension has at least 0.1 nanometers spectral resolution, spans 0.115 to 200 µm, and integrates to the total solar irradiance (TSI).
The extension was motivated by the need of certain climate applications to use the whole solar spectrum that spans “all wavelengths” and integrates to TSI. This wavelength coverage of this new data set is carefully chosen to meet the needs of the operational solar irradiance variability models and the climate community by only omitting wavelength with minor contributions to the TSI (e.g., below 0.015 mm contributed less than 0.0002% to the TSI).
Citation: Coddington, O. M., Richard, E. C., Harber, D., Pilewskie, P., Woods, T. N., Snow, M., et al. (2023). Version 2 of the TSIS-1 Hybrid Solar Reference Spectrum and Extension to the Full Spectrum. Earth and Space Science, 10, e2022EA002637. https://doi.org/10.1029/2022EA002637
—Astrid Maute, Editor, Earth and Space Science

