Since the beginning of the industrial revolution, people have increasingly congregated in urban areas so that as of 2005, more than half of us lived in cities [Cohen, 2006], There are about 28 megacities, defined by populations greater than 10 million. Most projected future growth in the world’s population will occur in urban areas [United Nations, 2014].
Air pollution often plagues industrialized cities, particularly during their early development. Episodes of high levels of sulfurous smog killed or sickened thousands in Donora, Penn., in 1948, as well as in London in 1952 [Bell and Davis, 2001; Helfand et al., 2001]. Other cities—primarily in the industrialized regions of the United States and Europe—also suffered from notoriously bad air quality. These events were the result of very high emissions of sulfur dioxide, smoke, and other particles during stagnant, foggy weather conditions.

As governments controlled more traditional pollution sources and urban vehicle fleets grew, a different type of air pollution also arose. Photochemical air pollution—a new phenomenon, distinct from sulfurous smog—clouded the skies over Los Angeles, first recognized in the 1950s. This type of air pollution results from photochemical reactions involving nitrogen oxides (NOx) and volatile organic compounds (VOCs; e.g., ethylene and benzene) that produce ozone (O3) and particulate matter. Both cause lung problems, among other deleterious effects, and particulate matter reduces visibility.
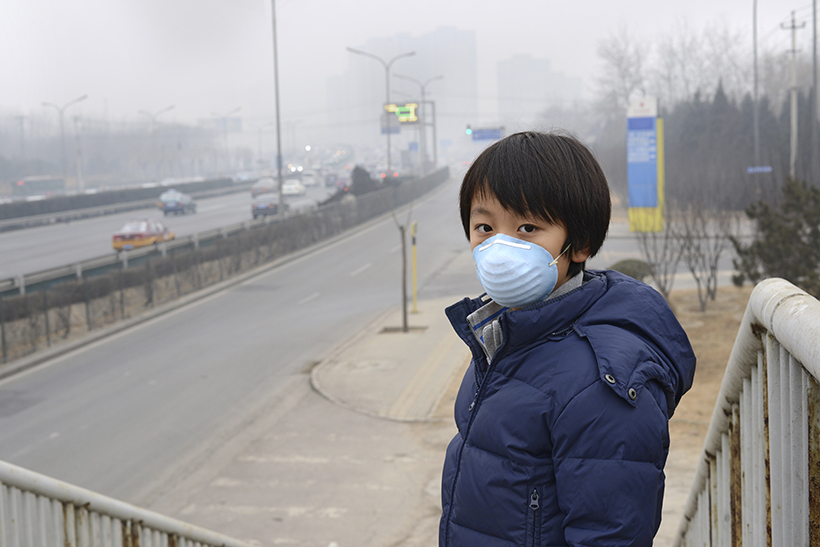
In North America and Europe, the coupling of industrialization and air pollution required the creation of air quality standards and regulations for emission sources such as vehicles, electrical power generation, and industrial facilities. The success of these efforts has caused the most severe air pollution episodes to be distant memories in those regions. However, as industrialization spread, air quality concerns also spread to other areas of the globe. For example, recent news headlines warn of extreme air pollution episodes in many Chinese cities, including Beijing, Shanghai, and Guangzhou (Figure 1), showing that urban air pollution remains a major world health issue [Chen et al., 2013; Grahame et al., 2014].
Cleaning up the world’s air is a daunting task. However, a broad review of about 6 decades of efforts in Los Angeles, including how scientists overcame societal and technical challenges, demonstrates that air quality in megacities can, in fact, be greatly improved. Several questions remain: Looking forward, what new challenges will megacities now developing throughout the world face? Are there limits to further improvement of air quality in more developed countries? Looking back, has the improved air quality in our cities been worth the large expense required?
Steps Taken to Recover Air Quality over Los Angeles
At its height in the 1950s and 1960s, air pollution got so bad in Los Angeles that reportedly “parents kept their kids out of school; athletes trained indoors; citrus growers and sugar-beet producers watched in dismay as their crops withered; the elderly and young crowded into doctors’ offices and hospital ERs with throbbing heads and shortness of breath.” Motorcycle couriers even donned gas masks during particularly severe episodes. On rare occasions, ozone concentrations exceeded 600 parts per billion by volume (ppbv, representing nanomoles per mole ambient air), and 8-hour averages sometimes exceeded 300 ppbv (Figure 2a).
![Fig. 2. (a) Fifty-year history of reduction of ambient ozone concentrations (in parts per billion by volume (ppbv)) in Los Angeles and (b) a logarithmic plot of ambient concentrations of several air pollutants, normalized to 100 in 1960 [after Warneke et al., 2012; Pollack et al., 2013].](https://eos.org/wp-content/uploads/2015/01/PARRISH_4823_Fig-2_rgb.jpg)
In Los Angeles, scientific and engineering advances combined with political and societal commitment sustained over decades resulted in remarkable air quality improvement. The city took a comprehensive approach that addressed all emission sources. Officials banned open burning and passed laws that curbed industrial pollution. They regulated emissions from electrical power generation; plants emitting in excess of certain thresholds closed. Companies built new power plants elsewhere and transmitted electricity into the city.
However, the most critical and effective efforts addressed motor vehicle emissions. Initial efforts controlled emissions of VOCs and included notably catalytic convertors, engine redesign, and fuel reformulation to minimize evaporation and optimize performance of emission controls.
Documenting Recovery
In Los Angeles, ambient concentrations of VOCs have decreased by a factor of 50 from 1960 to 2010 (solid purple line in Figure 2b), despite a threefold increase in fuel used [Warneke et al., 2012]. Compared with their counterparts in 1960, modern automobiles emit less than 1% as many VOCs per distance traveled. Motor vehicle emissions of NOx have decreased more slowly: Ambient concentrations of NOx have decreased by a factor of 4 from 1960 to 2010 (solid orange line in Figure 2b) [Pollack et al., 2013].
Photochemical modeling of the historical changes in pollutant concentrations in Los Angeles has not been accomplished in detail, mainly because of difficulties in reconstructing the emissions inventory. Modeling particulate matter, especially secondary organic aerosols, is particularly challenging. Measurements and modeling do show that the photochemistry of VOCs and NOx is nonlinear, and ambient concentrations of ozone, peroxyacetyl nitrate (PAN), and particulate matter have responded in a complex manner to emission changes.
Ozone has decreased at about the same rate as NOx (Figure 2b), but detailed chemical modeling shows that this is not a simple causal relationship. The ratio of ambient VOCs to NOx, which controls many aspects of the photochemistry, has decreased by a factor of about 12 over the period from 1960 to 2010 because of different reduction rates of VOCs and NOx emissions. Interestingly, PAN (which was responsible for severe eye irritation in Los Angeles several decades ago) has decreased by a factor of about 130, a decrease greater than that of either VOCs or NOx.
Challenges to Curbing Air Pollution
Why did the improvements shown in Figure 2 take so long to accomplish? Not only was development of the scientific understanding and engineering advances challenging, but protracted legal, social, and political processes also slowed implementation of the required emission controls.
Effective air pollution control efforts require concerted action over the entire airshed. This proved difficult—the Los Angeles region contains 3 counties and more than 50 separate cities. Progress proceeded slowly until officials formed the South Coast Air Quality Management District in 1976, which then regulated all stationary emission sources within the region in a consistent and comprehensive manner.
Government officials, industry managers, and the public have maintained these concerted pollution control efforts for more than 50 years in Los Angeles. Progress there and across the United States occurred over such a long period that many have forgotten how bad air pollution once was and have failed to notice the gains made. In fact, most people alive in the United States today never experienced the very poor air quality of Los Angeles that occurred in past decades. This fading societal memory poses another challenge: how to ensure that improved air quality is not compromised as communities focus on efforts to spur depressed economies and deal with other urgent societal problems.
Los Angeles: A Pollution Analogue for China?
Residents of Beijing now face problems from degraded air quality similar to those the residents of Los Angeles once faced. As the Guardian reports, “Chinese scientists have warned that the country’s toxic air pollution is now so bad that it resembles a nuclear winter, slowing photosynthesis in plants—and potentially wreaking havoc on the country’s food supply” [Kaiman, 2014].
The comparison between cities in Figure 1 suggests that present urban visibility degradation in Beijing is similar to that in Los Angeles 65 years ago. Although measurement methods and data reporting procedures have changed, in situ atmospheric measurements of particulate matter suggest that the maximum concentrations in Beijing now may be higher than those ever experienced in Los Angeles, but on an annual average basis, Los Angeles may have had worse particulate matter air quality.
In contrast, reported O3 concentrations in Beijing seldom exceed 200 ppbv [e.g., Zhang et al., 2004], so O3 in Los Angeles had been worse than what Beijing has experienced so far. Air pollution in cities such as Beijing is in transition from sulfurous smog to photochemical air pollution. The rapid increase in motor vehicles in Beijing and other developing cities may lead to greater photochemical O3 production and higher future O3 concentrations.
A Regional, If Not Global, Approach
As urbanization, global population, and economic development increase, long-range transport of pollution becomes an increasingly important factor for cities looking to improve air quality. Regardless of where we live, air flow brings pollution from our upwind neighbors to us, whether those neighbors are nearby urban areas, adjacent states or countries, or relatively distant continents. Similarly, transport of our own pollution affects our downwind neighbors.
The importance of regional transport of pollutants originally emerged in Europe (e.g., acid precipitation [Nordo, 1976]) and later in North America (e.g., Ozone Transport Assessment Group research in the eastern United States [Parker and Blodgett, 1999]). In Houston—a city that recently rivaled Los Angeles for the worst U.S. air quality largely because it is home to a large fraction of the U.S. petrochemical industry—the contribution of O3 transported into the city has been, on average, larger than the contribution of local photochemical production, even on days when O3 exceeded the National Ambient Air Quality Standards (NAAQS) [Berlin et al., 2013].
Long-range transport of O3 and particulate matter is an important issue to consider in all urban areas, not only in the more developed countries where local emissions have already been stringently controlled but also in densely populated developing countries, where large cities lie in close proximity to one another. In Asia, high population densities over a very broad region mean that the regional transport of pollution amplifies risks from poor Asian air quality in ways that have no analogue in the United States. For example, more than 800 million people live in eastern China, which includes Beijing and four other megacities. The air flowing into each of these cities will often carry a concentrated mix of aged pollution from an upwind city. The addition of fresh emissions from local sources to the transported pollution will likely present new challenges to scientific understanding of photochemical smog—challenges that must be surmounted in the effort to improve Chinese air quality.
Just as the establishment of the South Coast Air Quality Management District was required to effectively improve the air quality in Los Angeles, it is likely that the entire eastern China region, or at least the North China Plain, will need to be treated as a single air basin before improvement in air quality can be seen in Beijing, Shanghai, and the surrounding areas.
![Fig. 3. Results of a modeling study of ozone during a pollution episode that encompassed nearly all of eastern China. Adapted with permission from Zhao et al., [2009]. ©American Chemical Society.](https://eos.org/wp-content/uploads/2015/01/PARRISH_4823_Fig-3_rgb.jpg)
The modeling results shown in Figure 3 emphasize that, in effect, the entire eastern China region should be considered to be one very large super megacity. Other areas in Asia (e.g., the Indo-Gangetic Plain) may face similar problems and may need similar concerted mitigation efforts.
Limits to Air Quality Improvement
Despite the documented successes in the United States following implementation of the Clean Air Act, the United States’s ability to improve air quality has limits. Figure 2a shows that O3 mixing ratios have now dropped much below those observed before 1970; however, this decrease cannot continue indefinitely. Air flowing into the United States contains background O3 concentrations, and similar considerations exist for particulate matter.
An emerging challenge for American policies involves determining at what point air quality has been improved to an optimum extent. Even the background O3 and particulate concentrations transported into the country may have adverse health effects; however, these concentrations cannot be reduced solely by local and regional emission control efforts. Setting the U.S. NAAQS while considering only health impacts without regard to feasibility—as currently is required of the U.S. Environmental Protection Agency (EPA)—will likely lead to standards that cannot be met in some areas.
Are Pollution Control Efforts Worth It?
Has the improvement of air quality in U.S. urban areas been worth the cost? EPA conducted a series of studies to specifically determine how the overall health, welfare, ecological, and economic benefits of Clean Air Act (CAA) programs compare to the costs of these programs.
The first report released in 1997 presented a retrospective analysis of costs and benefits for the period spanning 1970 to 1990, and the later reports provided a prospective analysis for 1990 to 2020. These reports underwent extensive review by panels of outside experts and by the Department of Labor and Department of Commerce.
EPA found that improving air quality has been costly: Control efforts from 1970 to 1990 cost an estimated $0.52 trillion (inflation adjusted to 1990 dollars), whereas the central estimate of total monetized benefits of the CAA from 1970 to 1990 was $22 trillion. Thus, the air quality improvement that resulted from the CAA from 1970 to 1990 was quite cost-effective, with benefits exceeding costs by a ratio of approximately 42:1 (best estimate). Subsequent EPA reports found continuing large benefit-to-cost ratios.
In addition, as noted in the first report, “there are social and personal values furthered by the Clean Air Act, which have not been effectively captured by the dollar-based measures” used in the studies. Reductions in adverse health and environmental effects enhance quality of life well beyond factors that can be monetized. How can one fairly value a morning walk while breathing fresh air and enjoying a view of the surroundings? Such an activity was seldom available to Los Angeles residents during the mid-20th century.
The EPA reports can assure developing megacities that investments in air quality improvement are rewarded by improved health and general well-being of the urban populations. Although the experience in the United States may not directly apply to other megacities, it is a guide to some of the scientific, technical, and policy approaches required elsewhere.
References
Bell, M. L., and D. L. Davis (2001), Reassessment of the lethal London fog of 1952: Novel indicators of acute and chronic consequences of acute exposure to air pollution, Environ. Health Perspect., 109(3), 389–394.
Berlin, S. R., A. O. Langford, M. Estes, M. Dong, and D. D. Parrish (2013), Magnitude, decadal changes and impact of regional background ozone transported into the greater Houston, Texas area, Environ. Sci. Technol., 47(24), 13,985–13,992, doi:10.1021/es4037644.
Chen, Y., A. Ebenstein, M. Greenstone, and H. Lie (2013), Evidence on the impact of sustained exposure to air pollution on life expectancy from China’s Huai River policy, Proc. Natl. Acad. Sci. U. S. A., 110(32), 12,936–12,941, doi:10.1073/pnas.1300018110.
Cohen, B. (2006), Urbanization in developing countries: Current trends, future projections, and key challenges for sustainability, Technol. Soc., 28, 63–80, doi:10.1016/j.techsoc.2005.10.005.
Grahame, T. J., R. Klemm, and R. B. Schlesinger (2014), Public health and components of particulate matter: The changing assessment of black carbon, J. Air Waste Manage. Assoc., 64(6), 620–660, doi:10.1080/10962247.2014.912692.
Helfand, W. H., J. Lazarus, and P. Theerman (2001), Donora, Pennsylvania: An environmental disaster of the 20th century, Am. J. Public Health, 91(4), 553.
Kaiman, J. (2014), China’s toxic air pollution resembles nuclear winter, say scientists, Guardian, 25 Feb. [Available at https://www.theguardian.com/world/2014/feb/25/china-toxic-air-pollution-nuclear-winterscientists.]
Nordo, J. (1976), Long-range transport of airpollutants in Europe and acid precipitation in Norway, Water Air Soil Pollut., 6, 199–217.
Parker, L., and J. E. Blodgett (1999), Air quality: EPA’s ozone transport rule, OTAG, and Section 216 petitions—A hazy situation?, report, Congr. Res. Serv., Washington D. C [Available at https://digital.library.unt.edu/ark:/67531/metacrs935/.]
Pollack, I. B., T. B. Ryerson, M. Trainer, J. A. Neuman, J. M. Roberts, and D. D. Parrish (2013), Trends in ozone, its precursors, and related secondary oxidation products in Los Angeles, California: A synthesis of measurements from 1960 to 2010, J. Geophys. Res. Atmos., 118, 5893–5911, doi:10.1002/jgrd.50472.
United Nations (2014), World Urbanization Prospects: 2014 Revision Highlights, New York.
Warneke, C., J. A. de Gouw, J. S. Holloway, J. Peischl, T. B. Ryerson, E. Atlas, D. Blake, M. Trainer, and D. D. Parrish (2012), Multiyear trends in volatile organic compounds in Los Angeles, California: Five decades of decreasing emissions, J. Geophys. Res., 117, D00V17, doi:10.1029/2012JD017899.
Zhang, Q., B. Yuan, M. Shao, X. Wang, S. Lu, K. Lu, M. Wang, L. Chen, C.-C. Chang, and S. C. Liu (2014), Variations of groundlevel O3 and its precursors in Beijing in summertime between 2005 and 2011, Atmos. Chem. Phys., 14, 6089–6101, doi:10.5194/acp-14-6089-2014.
Zhao, C., Y. Wang, and T. Zeng (2009), East China Plains: A “basin” of ozone pollution, Environ. Sci. Technol., 43, 1911–1915.
Author Information
David D. Parrish, Cooperative Institute for Research in Environmental Sciences, University of Colorado, Boulder, and Chemical Sciences Division, Earth Science Research Laboratory, National Oceanic and Atmospheric Administration (NOAA), Boulder, Colo.; email: [email protected]; and William R. Stockwell, Department of Chemistry and the NOAA Center for Atmospheric Sciences, Howard University, Washington, D. C.
Citation: Parrish, D., and W. Stockwell (2015), Urbanization and air pollution: Then and now, Eos, 96, doi:10.1029/2015EO021803.
© 2015. American Geophysical Union. All rights reserved.