The turn of the millennium marked a decade of systematic measurements of exchanges of carbon, water, and energy between the biosphere and the atmosphere, made by a few pioneering scientists at their own study sites. New knowledge was—and still is—generated from these data at individual sites. It quickly became clear, however, that pooling together data from multiple sites would create a whole that is greater than the sum of its parts: a powerful tool not only for comparing and combining sites but also for studying land-air exchanges at regional and even global scales.
Scientists formed regional networks to foster sharing of data and methodologies, and FLUXNET was created, establishing a global “network of networks.” But a challenge remained: Data sets were still too diverse, incompatible, and hard to compare. In June 2000, at the Marconi Convention Center on the northern California coast, a group of scientists resolved to change that. The first FLUXNET data set was born.
FLUXNET2015 is the third data set in the series, following the original Marconi data set from 2000 and the widely used 2007 version produced after a workshop in La Thuile, Italy. Released in December 2015, with two augmentations in 2016, the FLUXNET2015 data set includes more than 1500 site-years of data at 30-minute intervals from 212 sites, ranging from the Norwegian tundra in Svalbard to the South African savanna in Kruger National Park, from the birch forests of Hokkaido, Japan, to the scrub oak near the launch pads of the Kennedy Space Center in Florida. Each site has records of fluxes of carbon, water, and energy and other ecosystem and biometeorological variables.
The fidelity of these flux measurements and their singular spatial and temporal coverage uniquely position them not only to help answer a broad range of questions about ecosystems, climate, and land use but also to bridge gaps between field observations and larger-scale tools like climate models and remote sensing. If past usage of FLUXNET data sets is any guide, we expect that scientists will use these data to validate satellite measurements, inform Earth system models, provide insight into a host of questions in ecology and hydrology, and fuel novel applications, many harnessing big data tools, on scales ranging from microbes to continents.
Updating FLUXNET Data Sets
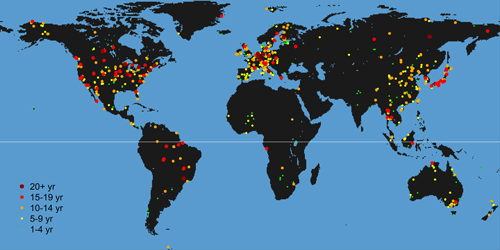
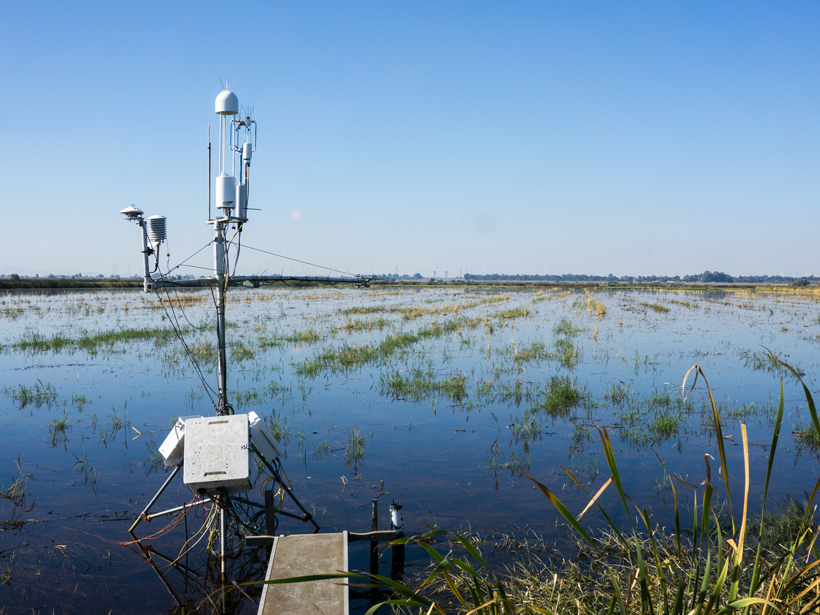
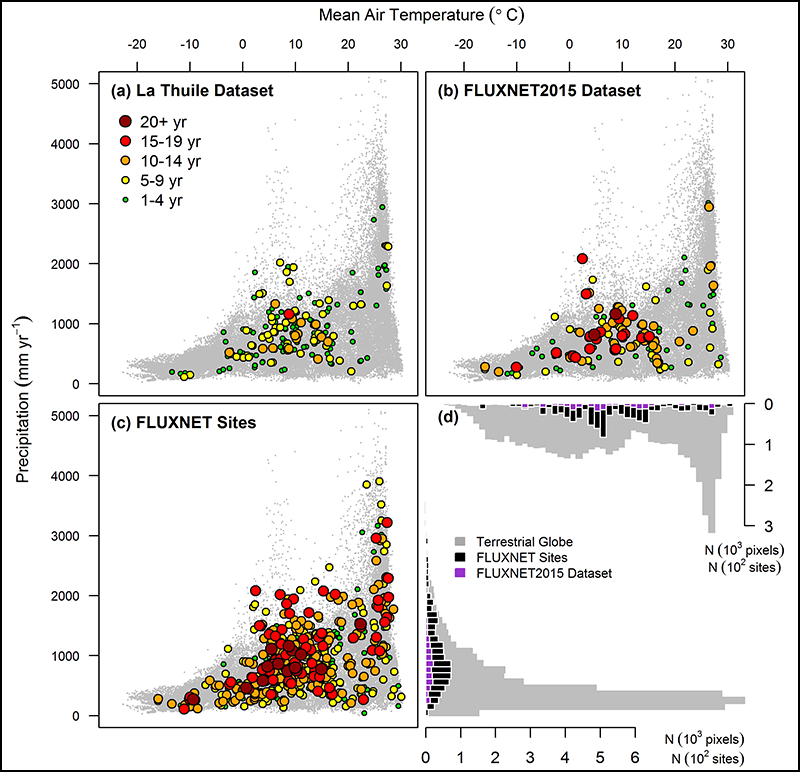
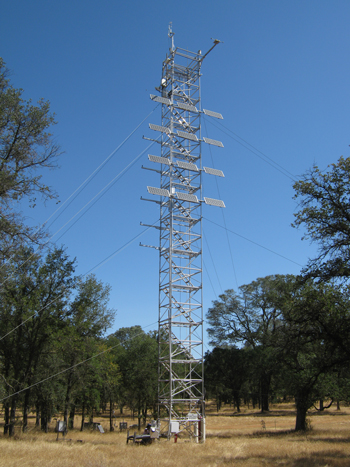
FLUXNET sites span all continents and all major climate zones (Figures 1 and 2; Figures 3 and 4 and the photograph above illustrate three sites). Some regions of the globe and ecosystem types are still underrepresented, but this newest release has improved coverage (see Figures 2a and 2b). Increased data contributions from regional networks in the Americas, Asia, Europe, and Oceania helped expand the geographic and temporal coverage of the data set.
The longest continuous flux data records now exceed 25 years. AmeriFlux and the European networks reached 20 years of age in 2016, and other networks host records nearly as long. This combination of longer time series and new sites from undersampled regions make the FLUXNET2015 data set the state of the art for understanding long-term interactions between the atmosphere and the biosphere and for addressing questions about year-to-year variability and trends in fluxes.
Such long flux records are also essential for gaining insight on extreme events and the ways that disturbed ecosystems respond over time. They can also help address emerging science questions, such as identifying the causes and effects of the greening of the Arctic, detected by nearly 30 years of remote sensing, or finding what drives the increasing amplitude of seasonal variability of atmospheric carbon dioxide (CO2), observed in nearly 60 years of records from the Mauna Loa Observatory in Hawaii.
This update was also motivated by the opportunity for higher-quality data. The FLUXNET data team and site teams collaborated on extensive data quality control that allowed us to avoid or correct many of the data issues that are common in observed data such as missing sensor calibrations or inconsistent processing of a measured variable. Advances in the science and the availability of complementary data sets also allowed for the creation of new data products, such as uncertainty estimates and better methods for filling long gaps in micrometeorological data.
Earlier FLUXNET data sets were used in hundreds of peer-reviewed papers, for studies ranging from soil microbiology to effects of climate change at a global scale. As a simple metric, a Web of Science keyword search for FLUXNET now yields more than 400 papers. Stimulating new science with useful data products is a main motivation behind the work to create FLUXNET data sets.
What’s Inside
Data collection at FLUXNET sites engenders only minimal disturbance to the ecosystem and produces flux estimates on temporal scales from hours to years, and now decades.
Data collection at FLUXNET sites engenders only minimal disturbance to the ecosystem and produces flux estimates representative of spatial scales of hundreds of meters and multiple temporal scales, from hours to years, and now decades. To make the data simple to use by scientists from many disciplines, data included in FLUXNET2015 were consistently quality controlled and gap filled. Also, ecosystem exchange of CO2 was partitioned into ecosystem respiration (as CO2 released into the atmosphere) and gross primary production (as CO2 uptake by the ecosystem).
The FLUXNET2015 data set includes a number of new features. One is the revised and extended data quality checks, which not only increase data quality for individual sites but also help harmonize quality levels among all sites. This uniformity in the data is important for synthesis analyses, which require sites to be comparable.
Also included for the first time are estimates of uncertainties for key steps in the processing. Some of the steps, such as filtering for low wind conditions and partitioning of CO2 fluxes, were implemented with multiple methods, resulting in more thorough estimates of uncertainties. These uncertainty estimates have been a long-standing request from ecosystem and Earth system modelers and make this data set especially useful for applications like model validation and constraining.
FLUXNET2015 also includes estimated energy corrections that were applied to achieve energy balance closure (between storage and incoming and outgoing energy), which makes the data more useful to climate and ecosystem models that require closed energy budgets when using flux data.
To fill long gaps in meteorological data, FLUXNET2015 used downscaled data based on the ERA-Interim global reanalysis data set, which provides a gridded and uninterrupted record derived using a data-informed model. This approach improved the accuracy of gap-filled micrometeorology data points and of temporally aggregated products such as those at daily or yearly resolutions.
Some of these data products and processing steps, especially the data quality checks, prevented some sites from being included in the data set. As a result, not all sites that contributed data or were part of the LaThuile data set were included in FLUXNET2015. The FLUXNET data team continues to work with these site teams to include data from their sites in future FLUXNET data sets.
Embracing the Benefits—and Challenges—of Open Data
Open data sharing has gained momentum and is becoming a cornerstone for scientific research. In principle, open data sharing doesn’t just benefit users—it also benefits the teams collecting the data by enhancing community integration, collaboration opportunities, data collection protocols, recognition for the data collection and curation work, and fulfilling funding agency requirements on data availability.
Data policies have evolved at least as much as the FLUXNET data sets themselves.
In practice, however, sharing data remains complicated. The extra work and the logistics of supporting open sharing are beyond the reach of many scientists. FLUXNET data sets are based on field data collected by many independent teams from many countries. The multisource nature of the data set brings the added challenge of ensuring that the various data collectors receive proper credit when their data are used. Proper attribution is also necessary for site teams to get a better measure of the impact of their work and opportunities to participate in the science using their data. Data policies aimed at addressing these requirements have been put in place to enable data sharing via the services provided by regional networks and FLUXNET.
Data policies have evolved at least as much as the FLUXNET data sets themselves. For the Marconi data set, the policy stated that site teams had to be informed of the data usage and could request work on conflicting topics be postponed. For the LaThuile data set, each site team classified their data into one of three data policy tiers. The most lenient required only acknowledgement of the data source. A middle tier required users to submit proposals, which needed approval by a committee with representatives from each regional network and FLUXNET. In the strictest tier, data access was restricted to the teams who contributed data.

The FLUXNET2015 data policy has matured to allow access to all interested users, with two tiers differing only in the terms for using the data, for example, for publications or class assignments. One tier requires acknowledgments, and the other requires that data providers be given the opportunity to add intellectual contributions and potentially become coauthors. This policy approach allows much broader access to the data and more opportunities to experiment with it.
Over the past decade, many FLUXNET site teams moved from being cautious about data sharing to being advocates for increased openness. FLUXNET’s track record of more than 20 years of sharing data helps pave the way toward reproducible science and should encourage other communities to tackle the challenges of sharing data sets with many sources and users.
Where We Go from Here
The FLUXNET2015 data set can be downloaded from the FLUXNET-Fluxdata website. Download it, use it, discover—have fun! And let us know: Questions, suggestions, and comments can be sent to [email protected]. Site teams interested in contributing data to future FLUXNET data sets are encouraged to contact their regional networks.
There is still much room for improving the spatial coverage and representativeness of future data sets, considering all the existing sites that are potential new data contributors (Figure 2c). We thank the site teams that helped us prepare their site data for inclusion in this data set and urge teams from sites that were not ready in time for this release to work with us to add their sites to upcoming data sets.
Acknowledgments
Site teams are the true engine of all FLUXNET datasets. Their extensive effort in collecting data, often under harsh working conditions, generating quality data products, and providing their data for use by a broad community is invaluable and irreplaceable. The FLUXNET2015 dataset is truly a community achievement!
This work used eddy covariance data acquired and shared by the FLUXNET community, including these networks: AmeriFlux, AfriFlux, AsiaFlux, CarboAfrica, CarboEuropeIP, CarboItaly, CarboMont, ChinaFlux, Fluxnet-Canada, GreenGrass, ICOS, KoFlux, LBA, NECC, OzFlux-TERN, TCOS-Siberia, and USCCC. The ERA-Interim reanalysis data are provided by ECMWF and processed by LSCE. The FLUXNET eddy covariance data processing and harmonization was carried out by the European Fluxes Database Cluster, AmeriFlux Management Project, and Fluxdata project of FLUXNET, with the support of CDIAC and ICOS Ecosystem Thematic Center, and the OzFlux, ChinaFlux and AsiaFlux offices.
Author Information
G. Z. Pastorello (email: [email protected]), Computational Research Division, Lawrence Berkeley National Laboratory, Berkeley, Calif.; D. Papale, Department for Innovation in Biological, Agro-food and Forest systems (DIBAF), University of Tuscia, Viterbo, Italy; H. Chu, Department of Environmental Science, Policy, and Management, University of California, Berkeley; C. Trotta, DIBAF, University of Tuscia, Viterbo, Italy; D. A. Agarwal, Computational Research Division, Lawrence Berkeley National Laboratory, Berkeley, Calif.; E. Canfora, Impacts on Agriculture, Forests and Ecosystem Services, Euro-Mediterranean Center on Climate Change, Viterbo, Italy; D. D. Baldocchi, Department of Environmental Science, Policy, and Management, University of California, Berkeley; and M. S. Torn, Climate and Ecosystem Sciences Division, Lawrence Berkeley National Laboratory, Berkeley, Calif.
Citation:
Pastorello, G. Z., D. Papale, H. Chu, C. Trotta, D. A. Agarwal, E. Canfora, D. D. Baldocchi, and M. S. Torn (2017), A new data set to keep a sharper eye on land-air exchanges, Eos, 98, https://doi.org/10.1029/2017EO071597. Published on 17 April 2017.
Text © 2017. The authors. CC BY 3.0
Except where otherwise noted, images are subject to copyright. Any reuse without express permission from the copyright owner is prohibited.