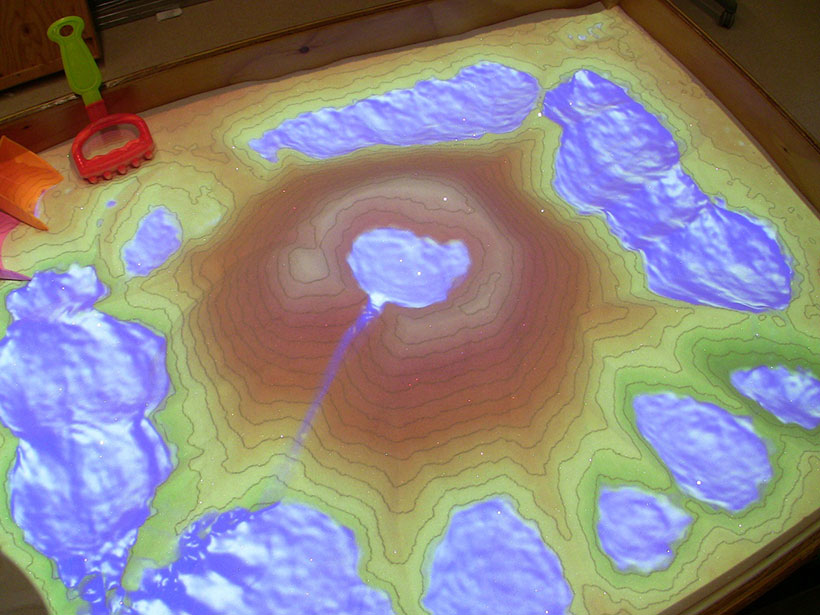
A student uses a rake to scrape sand in a 4 × 3 foot box, forming hills and valleys. Above, a Microsoft Kinect camera automatically gauges the distance to the sand and projects contour lines and colors onto the scene—cool colors for depressions, warm colors for peaks.
As the student pushes sand around into peaks, the colors swirl and dance, forming green and orange islands in a sea of blue. She hovers her palm over a mountain, and virtual rain pours down, slicking over cliffs and plunging into the blue.
With an augmented reality sandbox, many slow, large, and complex Earth processes can become more apparent and tangible.
The student is using a specially designed augmented reality (AR) sandbox, developed by the LakeViz3D project, a collaboration that seeks to foster public awareness and stewardship of freshwater ecosystems. Unlike virtual reality, which immerses the user in a digitally generated environment, AR superimposes visual, audio, and other digital effects onto a real-world scene or display that users can manipulate.
What results is an interactive tool for geoscience education and science communication. One of the challenges in learning Earth science is visualizing processes that occur over large spatial and temporal scales. However, with the Shaping Our Worlds AR Sandbox (AR Sandbox), many slow, large, and complex Earth processes can become more apparent and tangible.
What Is the AR Sandbox?
The AR Sandbox combines the power of exploration for advancing learning [Singer et al., 2006] via a kinesthetic experience in which users create topographic models by shaping sand with geoscience-relevant digital imagery [Reed et al., 2014].
The AR Sandbox uses a computer projector and a motion-sensing input device (e.g., a Microsoft Kinect 3D camera) mounted above a box of sand. The user shapes the sand in the box, and the camera detects the distance to the sand below. A three-dimensional (3-D) model of the sand surface is used to project contour lines and a color-coded elevation map representing the corresponding topography onto the sand’s surface. As users move the sand, the camera perceives the changes, and the projected colors and contour lines change accordingly.
When the camera senses an object (such as a hand) at a specified height above the sand surface, virtual rain appears below the object as a blue dynamically changing texture on the sand. A flow simulation model moves the water across the landscape in accordance with the laws of motion and the boundary conditions provided by the shape of the sand. The virtual water slowly disappears as the simulation computes its infiltration into the soil, or it can be drained rapidly with a push of a physical button or computer key.
History of Development
The prototype of the AR Sandbox was developed at the Keck Center for Active Visualization in Earth Science (KeckCAVES) at the University of California (UC), Davis. This project was originally inspired by the “Sandy Station,” developed by researchers working in the Czech Republic.
The AR Sandbox prototype became an interactive public exhibit for science education as part of a multidisciplinary National Science Foundation (NSF)–funded project called LakeViz3D. This collaboration of scientists, science educators, evaluators, museum professionals, and media developers created 3-D visualizations to help improve public understanding and stewardship of freshwater ecosystems. The first four AR Sandboxes were built at the science center partners of LakeViz3D: KeckCAVES; the Lawrence Hall of Science in Berkeley, Calif.; Tahoe Environmental Research Center in Incline Village, Nev.; and Ecology, Culture, History, and Opportunities (ECHO), Leahy Center for Lake Champlain in Burlington, Vt.
The software that produces the visualization is created using an open-source virtual reality development toolkit for 3-D graphics applications (VRUI) also developed at KeckCAVES. The flow visualization is based on the Saint-Venant shallow-water equations, a depth-integrated version of the Navier-Stokes fluid flow equations [Kurganov and Petrova, 2007].
Strong Engagement and Adaptable Earth Science Learning
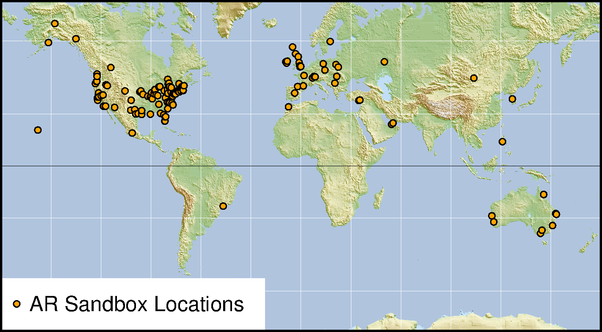
The AR Sandbox was initially launched in museum settings in 2012, and it has since been adapted for use in more than 150 universities, research centers, conferences, government organizations, and schools around the world. Applications span a wide variety of Earth science topics and learning environments.
People, regardless of age or background, like to learn by exploring. The tangible interaction and kinds of inquiry provided by the AR Sandbox provide a high level of engagement. Users are initially drawn in by the vibrant colors and water flow visualization. When they recognize that their actions can not only reshape the sand but also control the visualizations, they are truly hooked.
In the sandboxes at the LakeViz3D institutions, users often stay at the sandbox for more than 20 minutes (and sometimes more than an hour), far exceeding common dwell times at single exhibits. In addition, users are frequently observed working together on tasks they have set for themselves, especially building specific landscapes with the sand [Audience Viewpoints Consulting, 2014].
Educators can demonstrate a wide range of Earth science concepts interactively. For instance, they can show—and encourage students to build—the varied landforms found on Earth’s surface and illustrate how they were created by a variety of processes such as flooding, erosion, tectonics, and glaciation.
“The sandbox is a mesmerizing story-telling device.”
The U.S. Geological Survey Cascades Volcano Observatory reports that “the sandbox is a mesmerizing story-telling device.” They use the sandbox to explore, with visitors, how composite volcanoes like Mount St. Helens are built, what happened during the 1980 eruption, and how lahars can travel far downstream of a volcano.
Instructors have used the sandbox successfully to teach university-level students about topographic maps, hydrology, and geomorphology. At UC Davis, students in upper-division structural geology courses use the AR Sandbox to visualize subsurface structures before they go out into the field.
East Carolina University (ECU, Greenville, N.C.) faculty report that the AR Sandbox helps students in physical geology laboratories interpret contour lines and visualize the 3-D landscape depicted as lines on a topographic map—concepts that students find challenging. In addition, ECU students model, predict, and then explore whether water can move naturally on the surface from one drainage basin to an adjacent basin [Woods et al., 2015].
At the University of Redlands (Redlands, Calif.), instructors of geology and natural disasters courses found that the sandbox reduces barriers to spatial learning and helps students develop an intuition for understanding topography and its applications [Jenkins et al., 2014].
On the basis of these positive results, we propose that AR Sandboxes be more widely instituted in university geoscience education.
The AR Sandbox as a Tool for Science Communication and Research

The engagement and learning benefits of the sandbox can also help scientists communicate their research to policy makers, funding agencies, and the public.
Recently, the AR Sandbox was featured at this year’s annual meeting of the American Association for the Advancement of Science. One was also presented in the NSF booth at the USA Science and Engineering Festival in Washington, D. C., attended by more than 300,000 members of the public, and at the White House Water Summit. That particular AR Sandbox was then installed in a sixth grade classroom at the Middle School of Mathematics and Science on the Howard University campus.
Land management agencies can test environmental change scenarios in an AR Sandbox to inform decisions related to natural disaster planning.
At these gatherings, the visualizations provided by an AR Sandbox served as a powerful outreach and communication tool to engage politicians, collaborators, students, and funders in deeper conversations around large data sets involving local and global systems of change. For example, land management and planning agencies can test environmental change scenarios in an AR Sandbox to inform decisions related to natural disaster planning.
In fact, researchers at Newcastle University (Newcastle Upon Tyne, U.K.) are using an AR Sandbox to study and communicate flood risk. Educators at the Zephyr Education Foundation (Falmouth, Mass.) use the sandbox to build topographic models of Boston, with which they explore sea level rise and storm surge scenarios. Earth science researchers can also use AR Sandboxes to project a variety of Earth observation data (e.g., satellite images, vegetation indices, solar radiation) onto 3-D landscape models to better visualize and understand how spatial patterns of environmental data relate to topography.
Building the Next-Generation Learning Sandbox
Developers, scientists, and educators are invited to further enhance the capabilities of the sandbox and extend the modeling software. The 3-D software used to create the AR Sandbox is open source and freely available online, together with the sandbox blueprints, a facilitator’s guide (support and ideas for teaching with the sandbox), and a public forum for help troubleshooting sandbox issues or to post questions and suggestions.
We are excited to see the many innovative AR Sandbox applications and modifications that have emerged. We hope that others are inspired to explore the sandbox and expand its application in Earth science education, policy, and research.
Use this interactive Google map to find an AR Sandbox near you.
Acknowledgments
This material is based upon work supported by NSF grants 1114663 and 1135588. We gratefully acknowledge members and advisers of the LakeViz3D project, including those at UC Davis’s Tahoe Environmental Research Center; UC Davis’s KeckCAVES; UC Berkeley Lawrence Hall of Science; ECHO, Leahy Center for Lake Champlain; and Audience Viewpoints Consulting.
References
Audience Viewpoints Consulting (2014), 3D visualization tools for enhancing awareness, understanding and stewardship of freshwater ecosystems, Formative Eval. Rep. 1–6, Herndon, Va. [Available at https://informalscience.org/evaluation/ic-000-000-010-363/3D_Visualization_Tools_Formative.]
Jenkins, H. S., R. Gant, and D. Hopkins (2014), Shifting sands and turning tides: Using 3D visualization technology to shape the environment for undergraduate students, Abstract ED53B-3489 presented at Fall Meeting, AGU, San Francisco, Calif., 15–19 Dec.
Kurganov, A., and G. Petrova (2007), A second-order well-balanced positivity preserving central-upwind scheme for the Saint-Venant system, Commun. Math. Sci., 5(1), 133–160.
Reed, S., O. Kreylos, S. Hsi, L. Kellogg, G. Schladow, M. B. Yikilmaz, H. Segale, J. Silverman, S. Yalowitz, and E. Sato (2014), Shaping Watersheds Exhibit: An interactive, augmented reality sandbox for advancing Earth science education, Abstract ED34A-01 presented at Fall Meeting, AGU, San Francisco, Calif., 15–19 Dec.
Singer, D. G., R. M. Golinkoff, and K. Hirsh-Pasek (2006), Play = Learning: How Play Motivates and Enhances Children’s Cognitive and Social-Emotional Growth, Oxford Univ. Press, Oxford, U.K.
Woods, T. L., J. A. Woods, and M. R. Woods (2015), Using the Kreylos Augmented Reality Sandbox to teach topographic maps and surficial processes in an introductory geology lab at East Carolina University, Geol. Soc. Am. Abstr. Programs, 47(7), 111.
Author Information
Sarah Reed, The Lawrence Hall of Science, University of California, Berkeley; email: [email protected]; Sherry Hsi, The Concord Consortium, Emeryville, Calif.; Oliver Kreylos, M. Burak Yikilmaz, and Louise H. Kellogg, Department of Earth and Planetary Sciences, University of California, Davis; S. Geoffrey Schladow, Tahoe Environmental Research Center, University of California, Davis; Heather Segale, Tahoe Environmental Research Center, University of California, Davis, Incline Village, Nev.; and Lindsay Chan, Department of Earth and Planetary Sciences, University of California, Davis
Citation:
Reed, S.,Hsi, S.,Kreylos, O.,Yikilmaz, M. B.,Kellogg, L. H.,Schladow, S. G.,Segale, H., and Chan, L. (2016), Augmented reality turns a sandbox into a geoscience lesson, Eos, 97, https://doi.org/10.1029/2016EO056135. Published on 26 July 2016.
Text © 2016. The authors. CC BY-NC 3.0
Except where otherwise noted, images are subject to copyright. Any reuse without express permission from the copyright owner is prohibited.