One of the most notable signals of rapid change in the Arctic is the loss of sea ice during summer months [Jeffries et al., 2013; Wang and Overland, 2012]. Not only does the ice cover less area during the summer, it’s also growing thinner [e.g., Stroeve and Notz, 2015]. Scientists have focused on studying the mechanisms responsible for summer ice loss, but they’ve paid less attention to the recovery of the sea ice in the autumn.
Most icebreaker-based research activity in the Arctic concludes by late September each year, resulting in a shortage of data for the autumn months. A new program, Sea State and Boundary Layer Physics of the Emerging Arctic Ocean, sponsored by the U.S. Office of Naval Research, has just completed a unique field campaign to investigate the dynamics of the autumn sea ice recovery in the Arctic.
Our expedition on board the newly commissioned R/V Sikuliaq collected data on the dynamics of air, sea, and ice from 28 September to 10 November 2015. During this time, the ice edge moved 250 nautical miles southward from the summer ice minimum in the Beaufort and Chukchi seas, reaching the Alaskan coast.
Making Waves
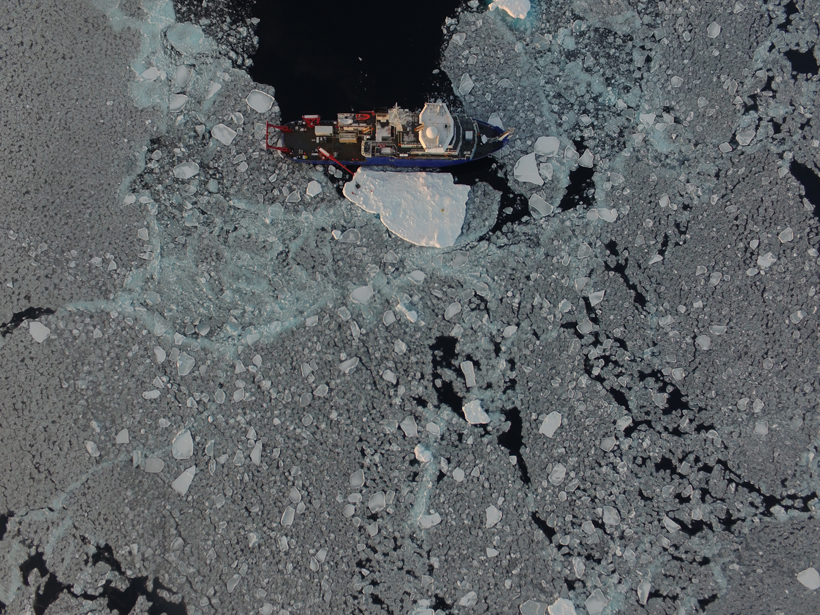
The field program was designed specifically to understand the effects of an increasingly dynamic sea state (that is, an increase in surface wave activity) on autumn ice recovery (Figure 1).

The loss of sea ice has not only increased the size of the open sea but also increased the size of the waves themselves, as surface waves have a greater distance over which they can form and grow. To express this in nautical terms, fetch has increased [Thomson and Rogers, 2014].
This effect is most pronounced at the end of September when sea ice extent is minimum (so fetch is maximum) and wind forcing is generally strong. Over the 6 weeks of the field campaign on board Sikuliaq, the simplest observation of all—visual confirmation of pancake ice formation—showed the effect of increased fetch on surface waves (Figure 2).

Pancake Ice
Pancake ice forms when wave orbital motions (that is, circular wave movements) disturb collections of ice crystals in the water, collectively called “frazil ice,” as the ice forms. Frazil ice is “slushy”—soft and amorphous—because the water is moving too much to allow a solid sheet of ice to form. Quiet waters can form large, thin, flat sheets of new ice, called “nilas,” but the mobilized frazil aggregates into small floes that float on the sea surface and collide as each wave passes.
The collisions make floes round, such that they resemble pancakes. Because the pancakes are typically 1 meter or less in diameter, they are below the resolution of most satellite imagery. This means that they are observed only from nearby, from ships or airplanes, or by autonomous platforms with cameras.
Pancake ice is relatively ubiquitous in the Antarctic sea marginal ice zone, but it has rarely been observed in the Beaufort and Chukchi seas. However, it was the dominant newly formed ice type that we encountered during this field campaign. We observed pancake ice with far greater regularity during this field campaign than in recent early autumn cruises in the eastern Beaufort conducted through the Joint Ocean Ice Study/Beaufort Gyre Exploration Project.
Clearly, the presence of pancake ice shows that wind events and the surface waves that come with them are important to the autumn ice recovery in the western Arctic Ocean. Wind and wave actions are perhaps also linked to the known trend of younger, thinner ice throughout the seasonal cycle [e.g., Maslanik et al., 2011].
Advance, Retreat, Advance
The prevalence of pancake ice has a large-scale effect on the autumn recovery of sea ice in the Beaufort and Chukchi seas. Figure 3 shows three maps of sea ice over 1 month; the daily progression is even more complex. As the wave motion declined (either in time or space), the pancakes often rafted together and thereby formed larger, thicker sea ice floes. The pancakes then consolidated (or “cemented”) into surface sheets that were rougher than nilas sheets; these sheets of pancake ice aggregates presumably survived and became the winter ice pack.

Sometimes, the pancakes’ dampening of the wave energy appeared to accelerate this cementing process, which eventually protected the interior pancakes from wave motions and allowed the larger floes to form. In some other events, however, strong wind- and wave-driven mixing of ocean heat prevented the ice edge from advancing, and the pancakes melted in place. Thus, the ice edge advanced one week, retreated the next, and eventually advanced again in an irregular pattern driven by the regional storm cycles.
Linked Effects from Air, Ice, and Ocean
The autumn recovery of sea ice is the result of a tightly coupled air-ice-ocean system. This system is described by a surface energy budget, which quantifies the flux of heat at the air-ocean interface. If the sea surface loses heat when its temperature is already near freezing, freezing occurs. Colder air temperatures can enhance ice formation, which we observed on several occasions when winds blew over existing ice and out to open water.
Heat flux from the upper ocean can also counteract or retard ice formation. With larger areas of the Arctic Ocean exposed to the summer Sun, the upper ocean accumulates more heat now than in previous years when it was ice covered for more of the seasonal cycle [Perovich et al., 2007]. This heat is often trapped in a near-surface temperature maximum layer [Jackson et al., 2010]. We observed strong winds and waves mixing this layer upward to the surface.
Diagnosing the freezing process and autumn ice recovery thus requires comprehensive air-ice-ocean measurements, including wave and wind forcing and sea ice transport. Observations from our fall 2015 Sea State field campaign, complemented by satellite, airborne, and shipboard remote sensing observations, are poised to improve our understanding of these processes.
Planning and Forecasting
The Sikuliaq cruise used a dynamic planning strategy that was crucial to adapt to the fast-changing region of our study. Every day, the whole onboard science team participated in updating our plans for the next 3 days, with detailed activities for the day to come and less detailed plans for the next 2 days.
The team based these plans on weather forecasts, wave forecasts performed aboard the ship, and ice data from satellite remote sensing telemetered to the ship by the shoreside team members. Our short-term wave forecasts were accurate in open water but much less so inside the ice cover. The accuracy of the remotely determined ice edge strongly affected the performance of the wave forecast. These forecasts tended to deviate substantially from observations during a strong wind event or rapid ice growth.
Analysis to Come
The 2015 autumn ice recovery demonstrated the highly interactive nature of ice, wave, atmospheric, and oceanic processes.
We have an enormous set of air, ice, and ocean measurements to analyze, both from the ship and from numerous autonomous platforms employed during the field campaign. The 2015 autumn ice recovery demonstrated the highly interactive nature of ice, wave, atmospheric, and oceanic processes. The winds and waves modulate this ice recovery, which influences, in turn, the interactions between the atmosphere and ocean.
This strongly coupled problem is clearly a massive challenge for the models we use to forecast the ice, waves, ocean, and atmosphere. These interactions cannot be implemented in computational codes before we understand them empirically or, better yet, the underlying physical principles are understood.
Our task now is to use these data to quantify the sea state and ice formation processes. The end goal is to improve prediction for immediate operational use and for long-term climate scenarios. We intend the subsequent model improvements to be useful to both the broader research community and the local communities who live along the Arctic coastline and experience climate change firsthand.
Our results will be published in a special issue of the Journal of Geophysical Research: Oceans that has been approved for 2017.
Acknowledgments
The Sea State and Boundary Layer Physics of the Emerging Arctic Ocean program is sponsored by the U.S. Office of Naval Research. The R/V Sikuliaq is owned by the National Science Foundation and operated by the University of Alaska Fairbanks.
References
Jackson, J. M., et al. (2010), Identification, characterization, and change of the near-surface temperature maximum in the Canada Basin, 1993–2008, J. Geophys. Res., 115, C05021, doi:10.1029/2009JC005265.
Jeffries, M., J. Overland, and D. Perovich (2013), The Arctic shifts to a new normal, Phys. Today, 66(10), 35.
Maslanik, J. A., et al. (2011), Distribution and trends in Arctic sea ice age through spring, Geophys. Res. Lett., 38, L13502, doi:10.1029/2011GL047735.
Perovich, D. K., et al. (2007), Increasing solar heating of the Arctic Ocean and adjacent seas, 1979–2005: Attribution and role in the ice-albedo feedback, Geophys. Res. Lett., 34, L19505, doi:10.1029/2007GL031480.
Stroeve, J., and D. Notz (2015), Insights on past and future sea-ice evolution from combining observations and models, Global Planet. Change, 135, 119–132, doi:10.1016/j.gloplacha.2015.10.011.
Thomson, J., and W. E. Rogers (2014), Sea and swell in the emerging Arctic Ocean, Geophys. Res. Lett., 41, 3136–3140, doi:10.1002/2014GL059983.
Wang, M., and J. E. Overland (2012), A sea ice free summer Arctic within 30 years: An update from CMIP5 models, Geophys. Res. Lett., 39, L18501, doi:10.1029/2012GL052868.
Author Information
Jim Thomson (email: [email protected]), Applied Physics Laboratory, University of Washington, Seattle; Stephen Ackley, Department of Geological Sciences, University of Texas at San Antonio; Hayley H. Shen, Department of Civil and Environmental Engineering, Clarkson University, Potsdam, New York; and W. Erick Rogers, U.S. Naval Research Laboratory, Stennis Space Center, Miss.
Citation:
Thomson, J.,Ackley, S.,Shen, H. H., and Rogers, W. E. (2017), The balance of ice, waves, and winds in the Arctic autumn, Eos, 98, https://doi.org/10.1029/2017EO066029. Published on 23 January 2017.
Text © 2017. The authors. CC BY-NC-ND 3.0
Except where otherwise noted, images are subject to copyright. Any reuse without express permission from the copyright owner is prohibited.