Source: Global Biogeochemical Cycles
Mercury is a naturally occurring, bioaccumulative element that can be toxic for humans. The form of mercury that famously tends to accumulate in seafood is known as monomethylated mercury or just methylated mercury (MeHg). In addition to understanding how this organic metal compound accumulates in food chains, scientists are also interested in tracking marine methylated mercury because past studies have suggested it may give insight into organic carbon remineralization. That process is important in understanding the carbon cycle and, by extension, climate change.
In a new study, Zhang et al. create one of the most complete global models of methylated mercury to date, which reveals several surprising findings. Starting with the Massachusetts Institute of Technology (MIT) general circulation model, the scientists added new data that captured the chemical changes that mercury and mercury-containing compounds undergo in the ocean, physical transport data describing how the metal moves laterally and vertically through the water and into the air, and data on which types of microbes are most likely to take up mercury and how it moves up through the food chain thereafter.
The results paint a complex picture and suggest that mercury uptake depends on many factors and cannot be predicted by organic carbon remineralization alone. The model predicts that the total mass of methylated mercury in the ocean is 290 megamoles, with 200 megamoles below a depth of 1,000 meters.

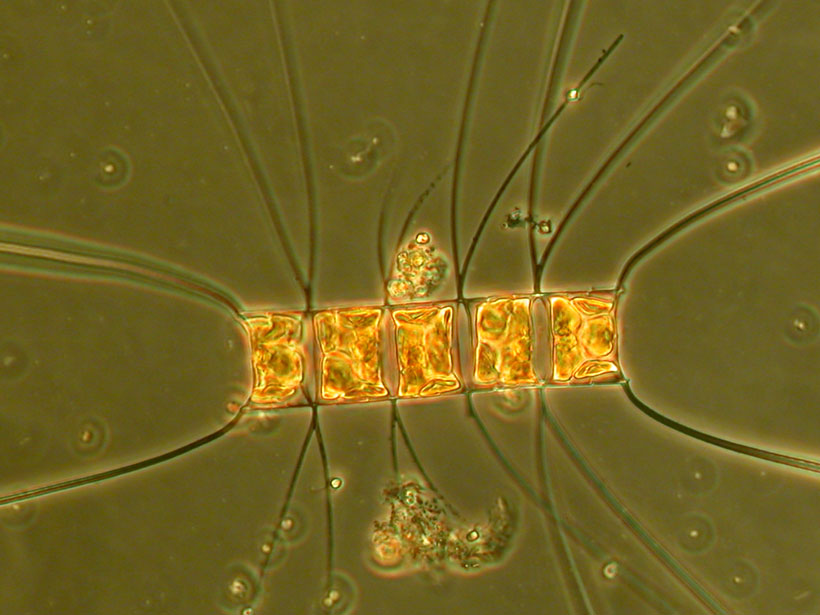
Overall, the researchers found that local forces dominate the spatial patterns of MeHg: Long-range transport appeared to have minimal influence, and the concentration of organic mercury depended mostly on what microbes were present and how much sunlight the region received. MeHg concentrations were high in polar regions, which the scientists attribute to both a lack of sunlight (which demethylates MeHg through a photochemical reaction) and lower temperatures. Concentrations were also higher in places like the eastern tropical subsurface waters of the Atlantic and Pacific Oceans—sites rich with atmospheric deposition (which is a major input of mercury) and high microbial activity. Finally, the model identified two groups of phytoplankton as major drivers of MeHg uptake and movement in the food chain: diatoms and Synechococcus. These phytoplankton absorb mercury from the environment and are then consumed by zooplankton, which are then, in turn, eaten by larger animals like fish and crustaceans.
As oceans warm and nutrient availability shifts both vertically and horizontally, the habitat ranges for both phytoplankton and zooplankton are expected to shift in response. The researchers suggest that these shifts may alter how and where mercury is being cycled and introduced into food webs, which will also depend on understanding myriad feedbacks in the ocean-climate system. (Global Biogeochemical Cycles, https://doi.org/10.1029/2019GB006348, 2020)
—David Shultz, Science Writer
Correction, 5 June 2023: This article has been updated to correct the units (from millimoles to megamoles) of the total mass of methylated mercury in the ocean predicted by the model described as well as the mass predicted below a depth of 1,000 meters.
Citation: Shultz, D. (2020), New models give global picture of mercury content in oceans, Eos, 101, https://doi.org/10.1029/2020EO142117. Published on 30 March 2020.
Text © 2020. AGU. CC BY-NC-ND 3.0
Except where otherwise noted, images are subject to copyright. Any reuse without express permission from the copyright owner is prohibited.