Many scientific disciplines use water column sonar data to map the ocean. Recent advances in sonar technology provide higher-quality data that result in larger data sets than ever before.
Sonar instruments emit sound pulses that reflect off objects in the water column. These instruments then measure the time and angle of the return pulses to detect and locate these objects. Water column sonar data cover from the near surface of the ocean to the seafloor, so they can contain information on a variety of environmental characteristics. Fisheries researchers analyze these data to study the attributes of fish schools or to characterize the habitats of commercially and ecologically important fish and invertebrate species [Simmonds and MacLennan, 2005].
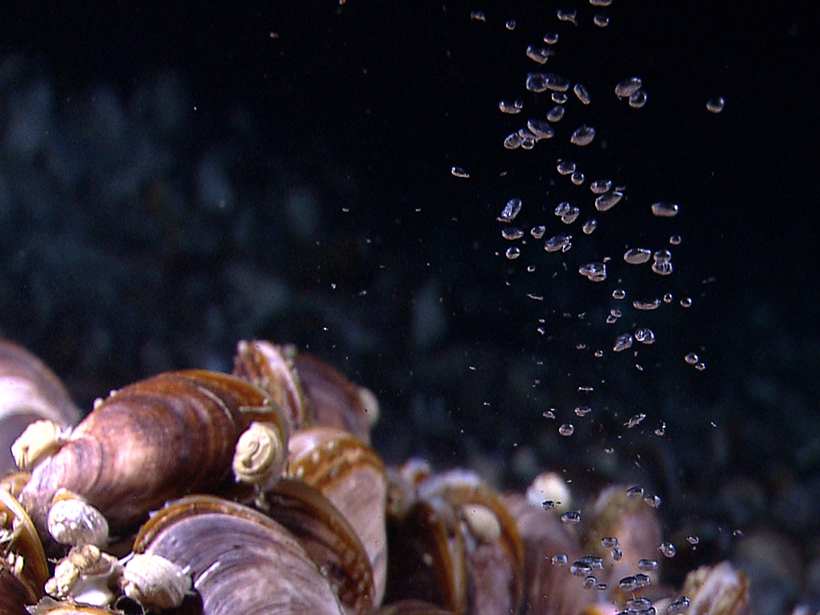
Combining sonar data with fisheries catch data helps inform management decisions, making sonar a valuable technology for ensuring the health of the fisheries’ stocks. Water column sonar data can also be used to identify undersea oil plumes and natural methane gas bubbles being emitted from the seafloor [Skarke et al., 2014; Weber et al., 2012].
To increase data utility, a central data archive could provide a large volume of data that would enable researchers to examine water column habitats on scales and in areas that are impractical for a single researcher to obtain.
Acoustic surveys by the National Oceanic and Atmospheric Administration (NOAA) National Marine Fisheries Service (NMFS) have collected more than 30 terabytes (TB) of water column sonar data, and they continue to collect more than 10 TB every year. The NOAA National Centers for Environmental Information (NCEI), in collaboration with NMFS and the University of Colorado, have established the Water Column Sonar Data Archive to steward water column sonar data to preserve and make these data available for the next generation.
An Archive of Integrated Information
Since the Water Column Sonar Data Archive became fully operational in 2013, it has made more than 27 terabytes of raw sonar data available to researchers and the public worldwide.
Since the Water Column Sonar Data Archive became fully operational in 2013, it has made more than 27 TB of raw sonar data available to researchers and the public worldwide. Sonar data sets were derived from multiple sonar instruments and include single-beam and multibeam systems with single and multiple frequencies. Low-frequency sonars running at 12, 18, and 38 kilohertz (kHz) are best for identifying some fish species and for reaching deeper depths, while higher-frequency sonars (120, 200, and 300 kHz) provide high-resolution data in shallow waters and are capable of discerning zooplankton and other small marine organisms.
Water column sonar data archived at NCEI can be discovered, queried, and requested online via its website. The website also contains information on cruise tracks that illustrate the geographic area covered by each survey. Once a user selects a cruise, the site displays metadata entered by the data provider. These metadata inform the reader of details about the cruise, including time period, principal investigator, and organizations involved in the data collection.
A single instrument using two frequencies can reveal a predator-prey distribution.
Raw data files come in proprietary formats, and reading them requires specialized acoustic processing software or knowledge of a scientific programming language. Although users who wish to use the raw acoustic data must provide these capabilities on their own, NCEI is developing visualization tools that anyone can use to quickly and easily illustrate data taken at one or more frequencies in a single image by depicting the dominating frequency or frequencies [Wall et al., 2016]. These images are being incorporated into the website.
Integrating interactive science with the archived raw data will help users determine whether the files are relevant to their research objectives. These steps aim to save time for both the user and the archive staff and will ultimately lead to a more efficient system by reducing unnecessarily large data requests.
Putting the Data to Use
Through proper management of the data, sonar systems can deliver valuable information beyond their original collection purpose. For example, comparisons of two sonar frequencies (38 and 120 kHz) have been used to distinguish between zooplankton, such as krill, and fish [e.g., Lawson et al., 2008; Madureira et al., 1993]. Thus, a single instrument using these two frequencies can reveal a predator-prey distribution. Figure 1 illustrates the location of such data collected in 2013 by NMFS that are available in the archive. These data could further be used to identify the presence of methane seeps emanating from the seafloor [Weber et al., 2012]. In addition to analyses on a cross-basin scale, studies examining multiple years are also feasible using archived data sets that were repeated annually in the same region.
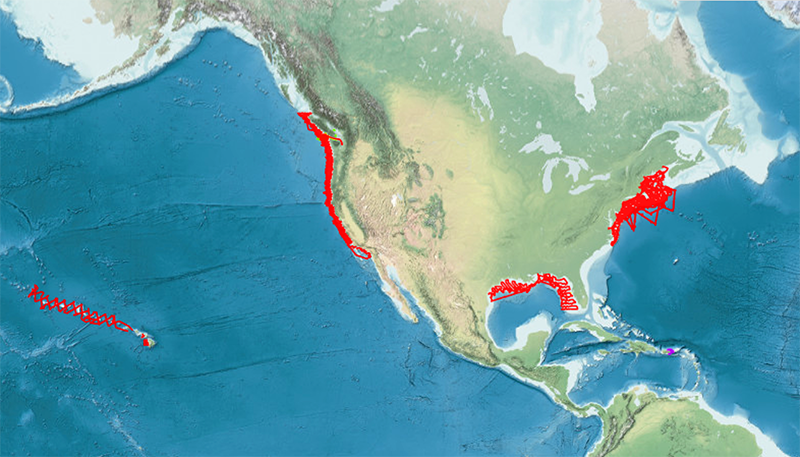
Sonar data within the archive date back to 1998, and data from sophisticated multiple-frequency multibeam sonar systems are available beginning in 2010. The archive contains historic (Simrad EK500) sonar data collected at 38 and 120 kHz for 52 cruises conducted between 1998 and 2007 located on the west and northeastern coasts of the United States. Similar data collected using a newer (Simrad EK60) system are available for 131 cruises conducted between 2003 and 2016 in all coastal regions of the continental United States, Puerto Rico, Guam, and the tropical Pacific and off the Palmer Archipelago in Antarctica.
As we work with NOAA and other researchers to archive more data sets in the near future, we will continue to increase the range (spatial and temporal) of data available. The centralized location and global access to an expansive data set enable researchers to explore marine acoustic research on scales that would have been impossible if they had to collect the data themselves.
The archive’s website also provides the data on salinity, temperature, and depth (CTD data) associated with a cruise when possible. The NCEI World Ocean Database subjects these data to quality control standards, and the data are used to calculate sound velocity profiles for further processing of the water column sonar data.
An Evolving Resource
Archived water column sonar data are freely available and accessible online using the website. Data citation information is provided for the archived cruises so that any reuse can be attributed back to the original data collector.
Archived water column sonar data are freely available and accessible online.
This is a relatively new endeavor, so the volume of data and number of sonar systems available from the archive will continue to grow as more data are collected and submitted to NCEI. If you are interested in archiving your water column sonar data, please contact us ([email protected]) to receive information on that process.
Acknowledgments
The archive is supported by NOAA NMFS and the National Environmental Satellite, Data, and Information Service. Technical support is provided by the NCEI Data Stewardship Division and the Center for Coasts, Oceans, and Geophysics, with special thanks to Charles Anderson. Main data providers include NMFS Fisheries Science Centers, the University-National Oceanographic Laboratory System, and the NOAA Office of Ocean Exploration and Research. The University of Colorado Cooperative Institute for Research in Environmental Sciences Communications Department and NCEI Coasts, Oceans, and Geophysics Information Services assisted in improving this article.
References
Lawson, G. L., P. H. Wiebe, T. K. Stanton, and C. J. Ashjian (2008), Euphausiid distribution along the western Antarctic Peninsula—Part A: Development of robust multi-frequency acoustic techniques to identify euphausiid aggregations and quantify euphausiid size, abundance, and biomass, Deep Sea Res., Part II, 55, 412–431, doi:10.1016/j.dsr2.2007.11.010.
Madureira, L. S. P., I. Everson, and E. J. Murphy (1993), Interpretation of acoustic data at two frequencies to discriminate between Antarctic krill (Euphausia superba Dana) and other scatterers, J. Plankton Res., 15, 787–802, doi:10.1093/plankt/15.7.787.
Simmonds, J., and D. N. MacLennan (2005), Fisheries Acoustics: Theory and Practice, 2nd ed., Blackwell, Oxford, U. K.
Skarke, A., C. Ruppel, M. Kodis, D. Brothers, and E. Lobecker (2014), Widespread methane leakage from the sea floor on the northern US Atlantic margin, Nat. Geosci., 7, 657–661, doi:10.1038/ngeo2232.
Wall, C. C., J. M. Jech, and S. J. McLean (2016), Increasing the accessibility of acoustic data through global access and imagery, ICES J. Mar. Sci., doi:10.1093/icesjms/fsw014.
Weber, T. C., A. De Robertis, S. F. Greenaway, S. Smith, L. Mayer, and G. Rice (2012), Estimating oil concentration and flow rate with calibrated vessel-mounted acoustic echo sounders, Proc. Natl. Acad. Sci. U. S. A., 109, 20,241–20,245, doi:10.1073/pnas.1108771108.
Author Information
Carrie C. Wall, Cooperative Institute for Research in Environmental Sciences, University of Colorado Boulder, and NOAA National Centers for Environmental Information, Boulder, Colo.; email: [email protected]
Citation:
Wall, C. C. (2016), Building an accessible archive for water column sonar data, Eos, 97, https://doi.org/10.1029/2016EO057595. Published on 15 August 2016.
Text © 2016. The authors. CC BY-NC-ND 3.0
Except where otherwise noted, images are subject to copyright. Any reuse without express permission from the copyright owner is prohibited.