
A year ago, the skies across the United States darkened as the Moon passed in front of the Sun. The 21 August 2017 celestial event dubbed the Great American Eclipse was the first total solar eclipse since 1918 to traverse the full width of the continental United States.
As millions of onlookers witnessed the extraordinary midday darkness and stillness brought on by the Moon’s shadow, a national meteorological observing network was doing what it always does. At 114 automated stations across all 50 U.S. states, the U.S. Climate Reference Network (USCRN) was taking accurate and precise readings every 5 minutes of surface temperature, air temperature, humidity, and other environmental conditions [Diamond et al., 2013].
Although taking those readings was just routine work for the network, our team foresaw that the coincidence of the USCRN’s ordinary data gathering with this remarkable eclipse could yield something extremely useful. That’s because many phenomena, from the daily setting of the Sun to fleeting events, such as dust storms and passing clouds, suddenly disconnect some piece of the land-atmosphere system from its main energy source, the Sun.
Data from the Great American Eclipse allows us to identify deficiencies in weather forecasting models and make improvements to them.
Many computer models developed to simulate and predict the land-atmosphere system’s behavior—in particular, weather forecasting and climate models—have difficulty accurately reproducing the system’s response to such disconnections and reconnections when they occur quickly or locally. In other words, problems arise when simulating such events on a scale of a few minutes to a few hours or when they occur in only small patches of a wider region.
Although eclipses might seem unrelated to weather and too rare to have implications for weather forecasting, they have the same effect of rapidly reducing the amount of incoming sunlight as other passing events that occur frequently and do affect the weather. Using data from the Great American Eclipse’s meteorological effects allows us to identify deficiencies in weather forecasting models and make improvements to them. These improvements help lead to better weather forecasts.
Coast-to-Coast Laboratory
For us, the Great American Eclipse was a grand, controlled experiment in a laboratory the size of a continent. Much like the results from any controlled laboratory experiment, USCRN’s measurements during the eclipse, from stations equipped with uniform suites of instruments, captured a telling set of responses to one type of change to the system. The eclipse applied that change across a wide range of geographic regions, climate types, and percentages of totality.
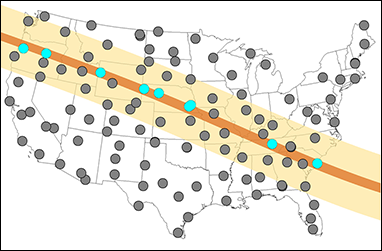
Across the entire USCRN, complete obscuration, or darkness, occurred at nine stations during the eclipse. Totality among those stations ranged from 0.52 minute at Lincoln, Neb., to 2.55 minutes at Crossville, Tenn. Fifty-four more stations had at least 75% obscuration, and all but one had at least 50% (Figure 1).
To gather the measurements relevant to the Great American Eclipse from USCRN’s database (all free and publicly available), we extracted the data collected every 5 minutes by each station from 2 hours before the moment at which the greatest obscuration of the Sun’s disk took place at that location until 2 hours after that moment. We then calculated the changes in select meteorological variables (i.e., air temperature, surface temperature, and relative humidity) during that period.
This unique data set is now helping meteorologists, climatologists, and environmental scientists to better understand and characterize feedbacks between the surface of the land and the overlying atmosphere during brief and/or localized interruptions in solar radiation. Those interruptions include a broad range of events such as when dense fog blankets an area, a dust storm arrives, prolonged wildfires break out, or a volcano’s ash cloud temporarily obscures the Sun.
Efforts to use the data to improve models of the land-atmosphere system are under way.
Likewise, efforts to use the data to improve models of the land-atmosphere system are under way. For instance, some of our colleagues at the National Oceanic and Atmospheric Administration (NOAA) laboratories in Boulder, Colo., are using our eclipse data to help evaluate high-resolution weather forecasting models, such as one called the High-Resolution Rapid Refresh (HRRR) model. A next-generation weather forecast model, HRRR assimilates radar data every 15 minutes and generates an updated forecast every hour. In contrast, the Global Forecast System and other more traditional weather forecast models, used widely in the United States by the National Weather Service, military branches, TV meteorologists, and others, produce new forecasts typically every 6 hours.
Wide-Ranging Responses
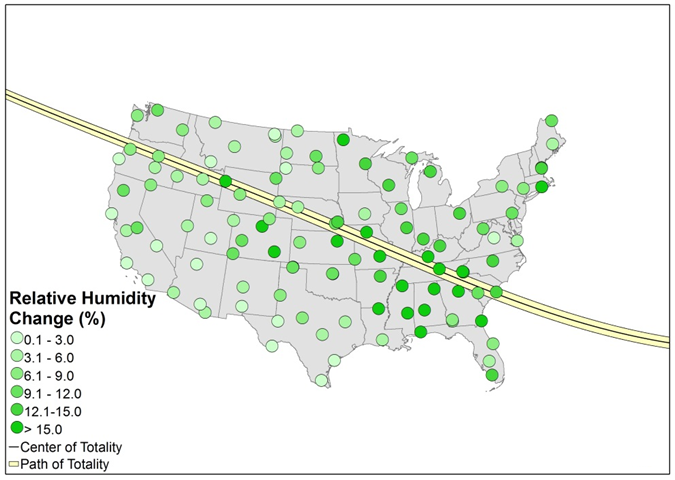
What effects did this grand experiment actually reveal from the eclipse’s switching off and on of local sunlight? The findings themselves are unremarkable in that the observed effects, such as the air and surface temperature decreases (Figures 2a and 2b, respectively) and relative humidity increases (Figure 3) as the Moon darkened the Sun’s disk, were well known and expected. Rather, capturing at multiple and varied locations precisely how much change took place and at what rates is the key result.
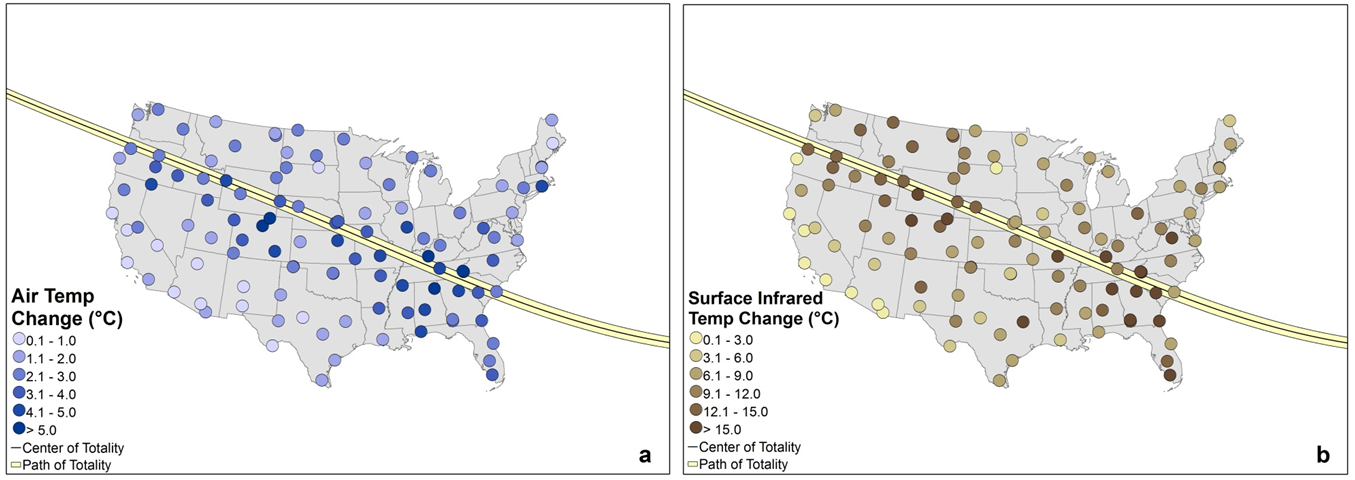
As expected, the largest impacts from the eclipse were found along its centerline. Other factors such as cloudiness and vegetation cover also affected land-atmosphere responses. Fortunately for this attempt to gauge exactly the impacts of solar obscuration, the Moon blocked the Sun at a time of day when solar radiation was strong and most of the United States had little cloud cover.
The effects were also stronger in the eastern part of the country, where daytime heating had progressed further and air masses had higher moisture content than in western states.
Overall, maximum cooling at USCRN stations ranged from 2°C to 5°C near the centerline (Figure 2a). Surface temperatures, which often undergo greater variations than air temperatures because the ground does a better job radiating heat than the air, fell at 109 sites, with decreases ranging from 5°C to 15°C (Figure 2b).
To illustrate the changes in solar radiation and temperature and the rapid pace at which those variations occurred because of the eclipse, our team created an animated map. The map uses colors to depict solar radiation intensity and temperature differences recorded by USCRN stations every 5 minutes during the Great American Eclipse. Watch it here (to start or stop the animation, click on the Time Slider icon at the top left). In addition, available online for free download from an FTP site is the full set of 5-minute data from the eclipse. You can also download animations of eclipse-related changes to solar radiation, air and surface temperatures, and relative humidity from our laboratory’s website.
A Different Perspective
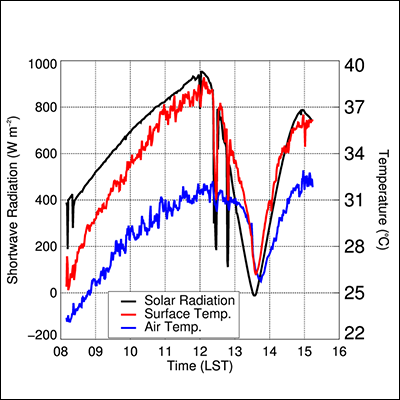
To independently validate the findings from the USCRN experiment, our team also monitored the eclipse with another set of instruments deployed near the town of Ten Mile, Tenn., which lies 75 kilometers southwest of Knoxville and on the path of totality. This site was ideal because it was in totality for 2.63 minutes, and fair weather conditions allowed for eclipse effects to be maximized.
There, NOAA scientists from the Air Resources Laboratory (ARL) Atmospheric Turbulence and Diffusion Division (ATDD) in Oak Ridge, Tenn., installed instruments, including some mounted on a drone, to measure ground surface and air temperature (also measured at all USCRN sites) and incoming and outgoing shortwave radiation (from the Sun) and longwave radiation (from Earth). Horizontal and vertical winds were also measured to study land-atmosphere interactions during the eclipse. Changes in all of the above meteorological conditions at Ten Mile proved consistent with findings from USCRN (see Figure 4 for Ten Mile temperature and solar radiation data).
Other measurements provided additional insights into the rapid changes in near-surface energy during the eclipse. Sensible heat flux, or transfer of heat from Earth’s surface into the atmosphere, decreased to near 0 watts per square meter around totality but increased toward the end of the partial phase.
We also found similar patterns in turbulent kinetic energy, or how much the air motion varies, during the eclipse. These large-scale, eclipse-driven patterns suggest that small-scale changes that happen whenever the surface energy is rapidly removed—for instance, by thick clouds or heavy aerosol loads obscuring the Sun—might likewise decrease the amount of turbulence in the lower atmosphere. This decrease could lead to less energy exchanged between the surface and the atmosphere, which would further reduce the turbulence.
Moving Forward
We expect to gain new perspectives on processes occurring within the lowest part of our atmosphere.
Whereas the continental-scale data set we gathered from USCRN offers us one way to study feedbacks between the land surface and atmosphere, targeted, regional field studies provide another.
For example, several authors of this eclipse study are involved with the Land Atmosphere Feedback Experiment (LAFE) [Wulfmeyer et al., 2018], a monthlong experiment last year in northern Oklahoma in August that used a dense network of sophisticated, near-surface meteorological observations to seek ways of better representing very complex interactions between the land surface and the atmosphere. Although the eclipse was not the focus of LAFE, the site did experience 89% obscuration, thereby providing another rich data set on the rapid, near-surface changes that occurred during the Great American Eclipse [Turner et al., 2018]
By combining such observations from fieldwork on relatively small scales with continental-scale observations like those from USCRN, we expect to gain new perspectives on the interactions and processes occurring within the lowest part of our atmosphere. Increasing our knowledge about these processes and learning how to better represent them ultimately will improve the weather forecasting models that we all rely on for our day-to-day activities.
Acknowledgments
We gratefully acknowledge the hard work of the USCRN technicians from NOAA/ARL/ATDD for installing and maintaining the network. We thank Mark Heuer from NOAA/ARL/ATDD for assembling the instruments used on the tower at Ten Mile and Kym, Tom, and Jerry Swanks, who allowed us to install the tower. We thank Devin Thomas of ERT, Inc., at NOAA National Centers for Environmental Information for assistance with graphics. We thank Michael Potter and Rick Saylor from NOAA/ARL/ATDD for developing the eclipse web pages. We acknowledge Rick Saylor and an anonymous reviewer, whose suggestions helped improved the quality of the manuscript. Finally, we note that the results and conclusions, as well as any views expressed herein, are those of the authors and do not necessarily reflect those of NOAA or the Department of Commerce.
References
Diamond, H. J., et al. (2013), US Climate Reference Network after one decade of operations: Status and assessment, Bull. Am. Meteorol. Soc., 94(4), 485–498, https://doi.org/10.1175/BAMS-D-12-00170.1.
Turner, D. D., et al. (2018), Response of the land-atmosphere system over north-central Oklahoma during the 2017 eclipse, Geophys. Res. Lett., 45, 1,668–1,675, https://doi.org/10.1002/2017GL076908.
Wulfmeyer, V., et al. (2018), A new research approach for observing and characterizing land-atmosphere feedback, Bull. Am. Meteorol. Soc., in press, https://doi.org/10.1175/BAMS-D-17-0009.1.
Author Information
Temple R. Lee (email: [email protected]) and Michael Buban, Cooperative Institute for Mesoscale Meteorological Studies, Norman, Okla.; also at Atmospheric Turbulence and Diffusion Division, Air Resources Laboratory (ARL), National Oceanic and Atmospheric Administration (NOAA), Oak Ridge, Tenn.; Michael A. Palecki, National Centers for Environmental Information, Asheville, N.C.; Ronald D. Leeper, National Centers for Environmental Information, Asheville, N.C.; also at Cooperative Institute for Climate and Satellites – North Carolina, North Carolina State University, Asheville; Howard J. Diamond, Atmospheric Turbulence and Diffusion Division, ARL, NOAA, Silver Spring, Md.; Edward Dumas, Oak Ridge Associated Universities, Tenn.; and Tilden P. Meyers and C. Bruce Baker, Atmospheric Turbulence and Diffusion Division, ARL, NOAA, Oak Ridge, Tenn.
Editor’s note, 24 September 2018: The story has been updated to reflect that eclipse-related animations are available on the project’s website.
Citation:
Lee, T. R.,Buban, M.,Palecki, M. A.,Leeper, R. D.,Diamond, H. J.,Dumas, E.,Meyers, T. P., and Baker, C. B. (2018), Great American Eclipse data may fine-tune weather forecasts, Eos, 99, https://doi.org/10.1029/2018EO103931. Published on 16 August 2018.
Text not subject to copyright.
Except where otherwise noted, images are subject to copyright. Any reuse without express permission from the copyright owner is prohibited.