
Ocean, atmosphere, and ecosystem processes in the North Pacific and western (Pacific) Arctic are critical to determining climate both locally and globally. Yet up-to-date depictions of this region’s seafloor depths have been lacking. Such information gaps can limit the effectiveness of oil spill responses, search and rescue missions, and scientific research projects, all of which rely on accurate information about ocean currents and the seafloor.
Specifically, oceanic circulation forecasts, geospatial mapping applications, and analyses of water column and seafloor environmental data require depictions of underwater terrain, or bathymetry. These depictions, represented as numerical matrices known as digital elevation models (DEMs), are ideally constructed with the most complete and up-to-date seafloor bottom sounding data available. Various DEMs are available; however, each has its own strengths and weaknesses, and not all data are publicly available. Unsurprisingly, bathymetric DEM resolution and quality are intimately tied to the accuracy of ocean circulation forecasts.
In the waters surrounding Alaska, many studies depend on adequately representing in ocean circulation models the passage of subarctic Pacific waters as they flow across the expansive and shallow Bering and Chukchi Sea continental shelves en route to the Arctic. The tightly interconnected nature of these shelves and their associated circulation systems and ecosystems require a single DEM that can be used by ongoing and future research projects.
A New Model
To assist the mapping, response, and research applications noted above, our team developed the Alaska Region Digital Elevation Model (ARDEM), which spans 130°E to 120°W and 45°N to 80°N with a horizontal grid spacing of 30″ in latitude and 60″ in longitude (Figure 1). The ARDEM grid provides both topographic elevation and bathymetric depth estimates for this entire region, with a horizontal resolution of approximately 1 kilometer.
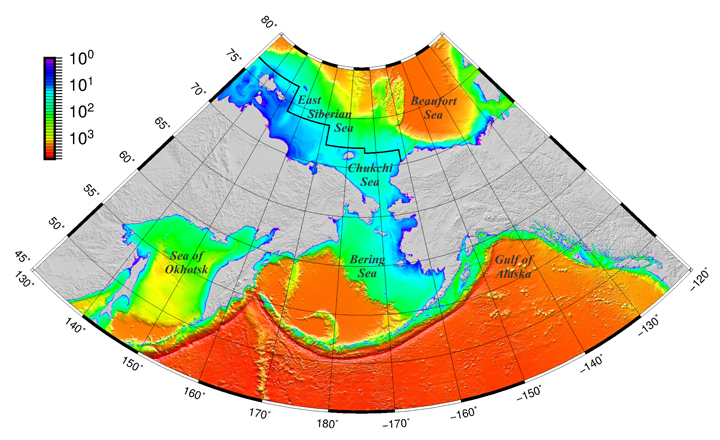
Three publicly available DEMs cover large portions or the entirety of the ARDEM region, but none fills the niche occupied by the ARDEM grid. The International Bathymetric Chart of the Arctic Ocean (IBCAO) [Jakobsson et al., 2012] charts a grid across the entire Arctic with a southern boundary located at 64°N in the northern Bering Sea. The General Bathymetric Chart of the Oceans (GEBCO) world map [Goodwillie and members of the informal Gridding Working Group of the GEBCO Sub-Committee on Digital Bathymetry, 2011] and Smith and Sandwell’s [Smith and Sandwell, 1997; Becker et al., 2009] satellite-based bathymetry DEMs represent the premier global seafloor DEMs.
The organizations that make the global elevation models benefit from regional data compilations (such as IBCAO and now ARDEM) that are able to identify and assemble data within smaller regions. To facilitate collaboration with regional mapping efforts such as ARDEM, GEBCO formed the Sub-Committee on Regional Undersea Mapping.
A Patchwork Quilt of Data
Such rapid change means that scientists making DEMs of the region are always scrambling to stay up to date.
Vertical elevations and coastline locations are particularly prone to change along Alaska’s coasts, where land masses rise under the reduced weight of melting glaciers (isostatic rebound) and earthquakes alter land and ocean elevations by meters or even tens of meters in the case of the 1964 Alaska earthquake. Ice, waves, and melting permafrost can erode as much as 20 meters of Alaska’s Arctic coast each year. Such rapid change means that scientists making DEMs of the region are always scrambling to stay up to date.
Adding to this complexity, compilation of large-scale bathymetric DEMs must contend with a patchwork quilt of data types, data quality, and vertical reference levels [Smith, 1993]. High-quality multibeam ship sounding data are desirable but sparse, particularly on the expansive high-latitude continental shelves [Wessel and Chandler, 2011]. Furthermore, many otherwise acceptable single-beam sounding data are degraded by poorly documented speed of sound and transducer depth equipment configurations. Soundings on nautical charts typically denote navigation hazards and so can be biased shallow with respect to the local mean water depth.
Regions such as large parts of the shallow shelves off the Arctic coast of Eurasia, where source data have not been readily accessible (e.g., because of government restrictions), often require grids to be constructed by digitizing latitude and longitude locations from contours on navigational charts. The contour lines on such grids can encompass large areas of the ocean, and they bias the gridded depths in a “terracing” effect [Marks and Smith, 2006].
A large fraction of the ARDEM region includes shallow sedimentary continental shelves. DEMs that employ satellite-based observations of gravity anomalies are imprecise over these regions because the measurements tend to represent subseafloor structure rather than the seafloor shape itself [Lee et al., 2010].
For these reasons and against this backdrop, we constructed the ARDEM grid without digitized contour lines and satellite-based depth estimates. This approach required us to make an extensive digitization effort to capture point soundings from published navigational charts.
Putting It All Together
We assembled ship-based depth sounding data from U.S. National Ocean Service and Canadian Hydrographic Service Electronic Navigation Chart point soundings, multibeam swath data sets, miscellaneous single-beam tracklines, and point soundings digitized from paper nautical charts.
We also incorporated National Ocean Service seafloor survey data served by the National Geophysical Data Center’s bathymetry database, along with other depth data from miscellaneous research cruises, including single-beam soundings from many Gulf of Alaska and Bering Sea expeditions aboard the R/V Miller Freeman and the R/V Alpha Helix. Other data include multibeam swaths from the Japan Agency for Marine-Earth Science and Technology R/V Mirai cruises.
An important set of data came from our recent digitization of 315 historic Russian nautical charts.
An important set of data new to bathymetric DEM efforts that covers the ARDEM region came from our recent digitization of 315 historic Russian nautical charts and chart insets from the Laptev Sea, the East Siberian Sea, the Chukchi Sea, the Bering Sea, and the Sea of Okhotsk. These charts had scales ranging from 1:1000 to 1:2,000,000. We georeferenced and digitized the soundings, yielding more than 6 × 10⁵ unique latitude-longitude-depth triplets.
Thirteen of the Russian charts were coarser than 1:500,000, and 110 were at a resolution of 1:50,000 or finer. We expect the maximum error in the location of each chart sounding to be on the order of ~1 centimeter (1 centimeter is equivalent to 500 meters on a 1:50,000 chart, and 1 centimeter is equivalent to 5 kilometers on a 1:500,000 scale chart). The nominal ARDEM grid spacing is 1 kilometer, so we believe that we were able to georeference data from charts with 1:50,000 resolution and higher into the appropriate ARDEM grid cells.
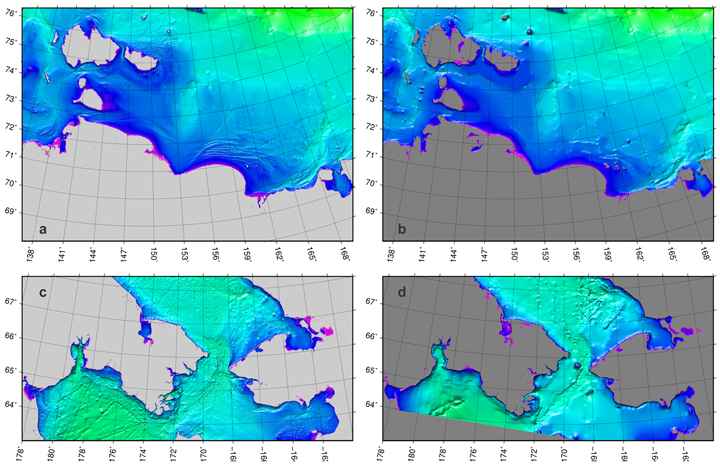
Soundings acquired prior to modern satellite-based positioning methods may have location accuracies that are coarser than the ~1-kilometer grid resolution. Nonetheless, we find that these newly digitized soundings can provide appreciably more seafloor detail than digitized contours. Compare, for example, the panels in Figure 2. The differences between the older IBCAO and newer ARDEM panels show why we spent so much effort in digitizing the chart point soundings.
The IBCAO grid provides elevations to the ARDEM grid over the northern East Siberian Sea, the northern Chukchi Sea, and the Beaufort Sea (see Figure 1), allowing a seamless integration of the two compilations by users who require elevations in areas that overlap both of these two grids. The ARDEM grid also includes data from sounding-based grid cells in Smith and Sandwell’s DEM (release version 14.1). Over land, elevations come from the National Geophysical Data Center’s Global Land One-km Base Elevation Project (GLOBE) grid [GLOBE Task Team et al., 1999].
The ARDEM grid provides a new research tool for the Pacific sector of the Arctic and subarctic shelf seas. The ARDEM grid itself and unrestricted data assembled for the ARDEM grid are available for other users through the Alaska Ocean Observing System. We anticipate that these data will help usher in a new era of precision Arctic modeling and mapping.
Acknowledgments
We gratefully acknowledge the numerous organizations and individuals whose efforts have helped us assemble this soundings data set, including the National Oceanic and Atmospheric Administration, the National Ocean Survey, the National Geophysical Data Center, the Canadian Hydrographic Service, the Japan Agency for Marine-Earth Science and Technology, the creators of the GLOBE DEM, the creators of the Smith-Sandwell DEM, the Hawaii Mapping Research Group, the University of New Hampshire Center for Coastal and Ocean Mapping, the Lamont-Doherty Marine Geoscience Data System, Ned Cokelet, Bill Kopplin, Steve Okkonen, Will Perrie, and Steve Solomon. Russian charts were digitized by East View Geospatial of Minneapolis, Minn. We thank two anonymous reviewers for their improvements. This work was funded with support from the Oil Spill Research Institute (OSRI) and the North Pacific Research Board (NPRB), NPRB project 1225 (NPRB publication 574).
References
Becker, J. J., et al. (2009), Global bathymetry and elevation data at 30 arc seconds resolution: SRTM30_PLUS, Mar. Geod., 32(4), 355–371.
GLOBE Task Team et al. (Eds.) (1999), The Global Land One-kilometer Base Elevation (GLOBE) Digital Elevation Model, Version 1.0, https://www.ngdc.noaa.gov/mgg/topo/globe.htm, Natl. Geophys. Data Cent., Natl. Oceanic and Atmos. Admin., Boulder, Colo.
Goodwillie, A., and members of the informal Gridding Working Group of the GEBCO Sub-Committee on Digital Bathymetry (2011), Centenary edition of the GEBCO digital atlas, users guide to the GEBCO one minute grid, Br. Oceanogr. Data Cent., Liverpool, U.K.
Jakobsson, M., et al. (2012), The International Bathymetric Chart of the Arctic Ocean (IBCAO) version 3.0, Geophys. Res. Lett., 39, L12609, doi:10.1029/2012GL052219.
Lee, Z., C. Hu, B. Casey, S. Shang, H. Dierssen, and R. Arnonem (2010), Global shallow-water bathymetry from satellite ocean color data, Eos Trans. AGU, 91(46), 429–430, doi:10.1029/2010EO460002.
Marks, K. M., and W. H. F. Smith (2006), An evaluation of publicly available global bathymetry grids, Mar. Geophys. Res., 27(1), 19–34, doi:10.1007/s11001-005-2095-4.
Smith, W. H. F. (1993), On the accuracy of digital bathymetric data, J. Geophys. Res., 98(B6), 9591–9603, doi:10.1029/93JB00716.
Smith, W. H. F., and D. T. Sandwell (1997), Global seafloor topography from satellite altimetry and ship depth soundings, Science, 277, 1957–1962.
Wessel, P., and M. T. Chandler (2011), The spatial and temporal distribution of marine geophysical surveys, Acta Geophys., 59(1), 55–71.
Author Information
Seth L. Danielson and Elizabeth L. Dobbins, University of Alaska Fairbanks, Fairbanks; email: [email protected]; Martin Jakobsson, Stockholm University, Stockholm, Sweden; Mark A. Johnson and Thomas J. Weingartner, University of Alaska Fairbanks, Fairbanks; William J. Williams, Institute of Ocean Science, Fisheries and Oceans Canada, Sidney, BC, Canada; and Yulia Zarayskaya, Geological Institute, Russian Academy of Sciences, Moscow, Russia
Citation: (2015), Sounding the northern seas, Eos, 96, doi:10.1029/2015EO040975. Published on 29 December 2015.
Text © 2015. The authors. CC BY 3.0
Except where otherwise noted, images are subject to copyright. Any reuse without express permission from the copyright owner is prohibited.