
In Santiago, mysterious pollution spikes—tenfold above normal levels—occur during televised soccer matches and are caused by tens of thousands of barbecues, new results reveal.
aerosols & particles

Posted inResearch Spotlights
Hardwood Forest Soils Are Sinks for Plant-Produced Volatiles
New research identifies temperature, moisture, and soil fungi as important factors in influencing how biogenic volatile organic compounds cycle between plants and the atmosphere.
Posted inNews
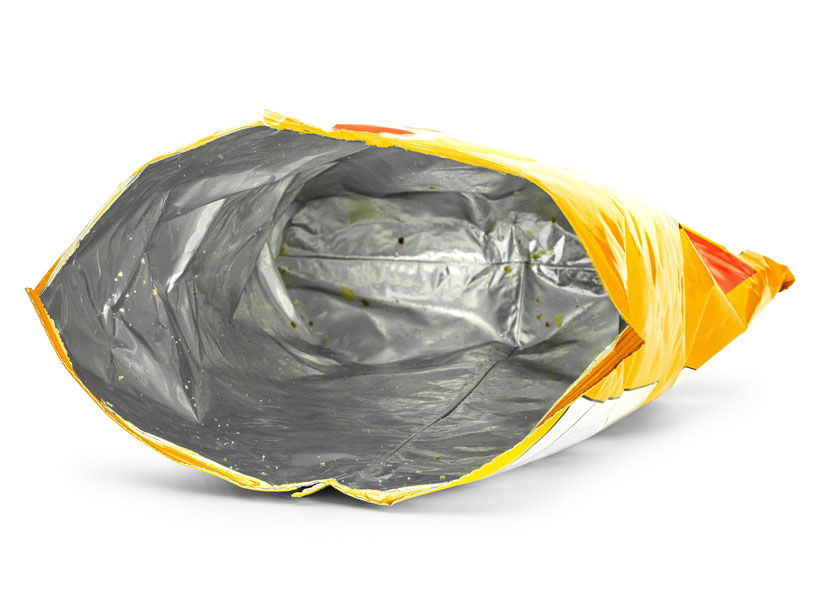
Tear, Don’t Cut, to Reduce Microplastics
Laboratory experiments reveal the numbers and types of microplastics produced by tearing, scissoring, and cutting everyday items.

Posted inNews
La Contaminación del Aire Puede Empeorar la Tasa de Mortalidad por COVID-19
Científicos descubren que condados altamente contaminados en los Estados Unidos tendrán una tasa de mortalidad por COVID19 4.5 veces más grande que aquellos condados similares.
Posted inResearch Spotlights
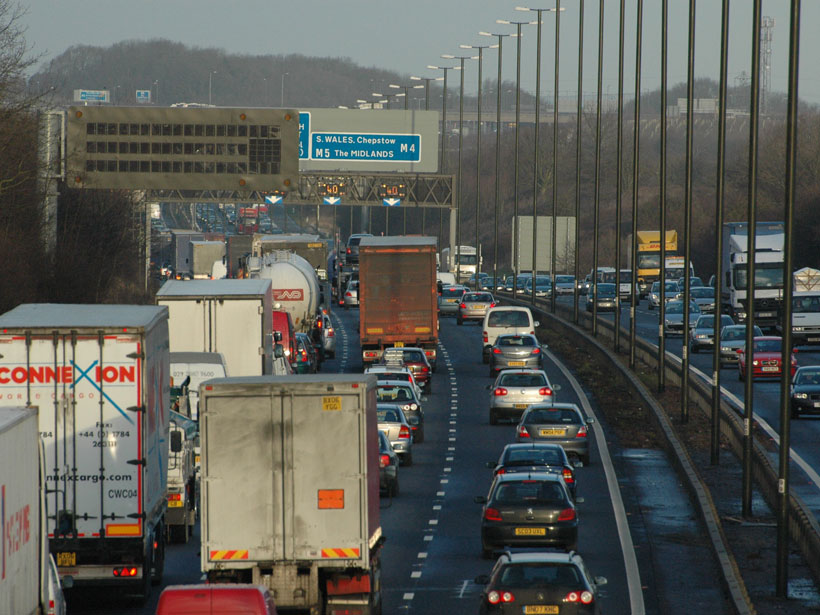
The Climate and Health Impacts of Gasoline and Diesel Emissions
New research tallies the effects of gas- and diesel-burning vehicle emissions on the climate, as well as on human health. Together, the emissions cause more than 200,000 premature deaths each year.
Posted inEditors' Highlights
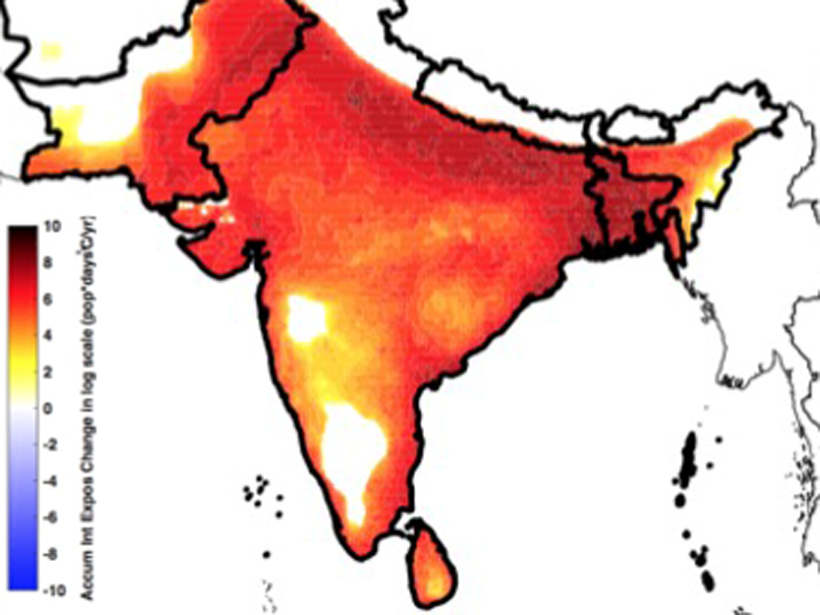
Health Concerns from Combined Heat and Pollution in South Asia
Little research has studied the impacts of combined climate conditions. Together, heat events and poor air quality in South Asia amplify the imminent health challenge.
Posted inNews
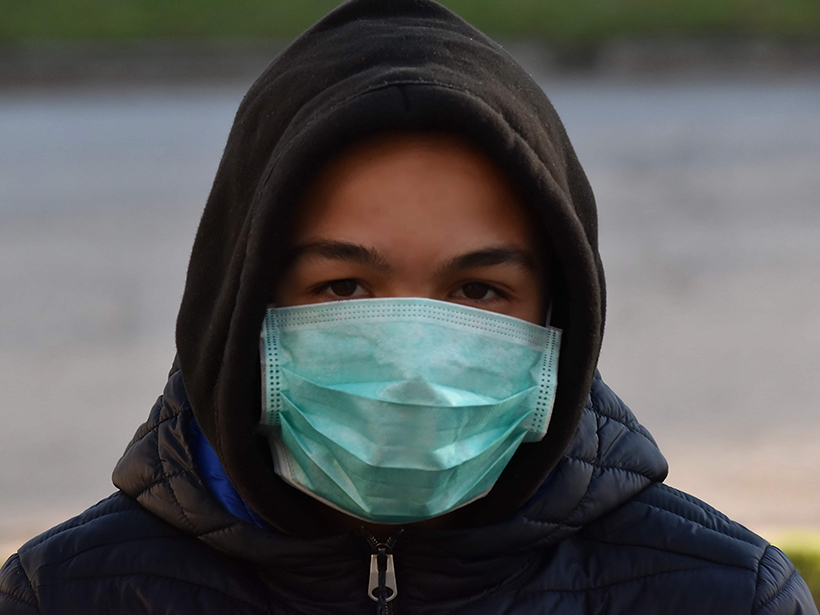
Air Pollution Can Worsen the Death Rate from COVID-19
Scientists find that highly polluted counties in the United States will have a COVID-19 death rate 4.5 times higher than those with low pollution if they’re otherwise similar.
Posted inEditors' Highlights
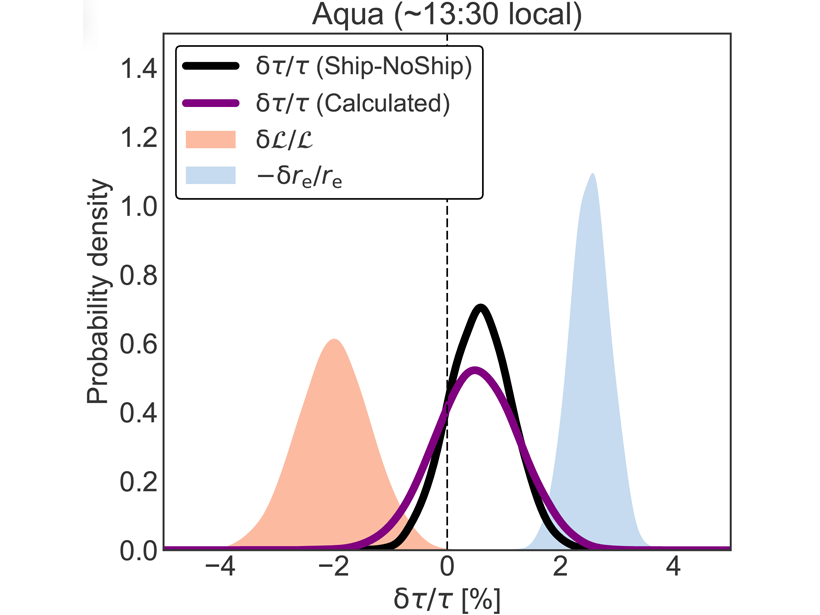
Quantifying Aerosol Effects on Climate Using Ship Track Clouds
A new methodology for measuring how human emissions influence cloud properties and radiative forcing developed by reconstructing cloud fields in maritime shipping lanes.
Posted inEditors' Highlights
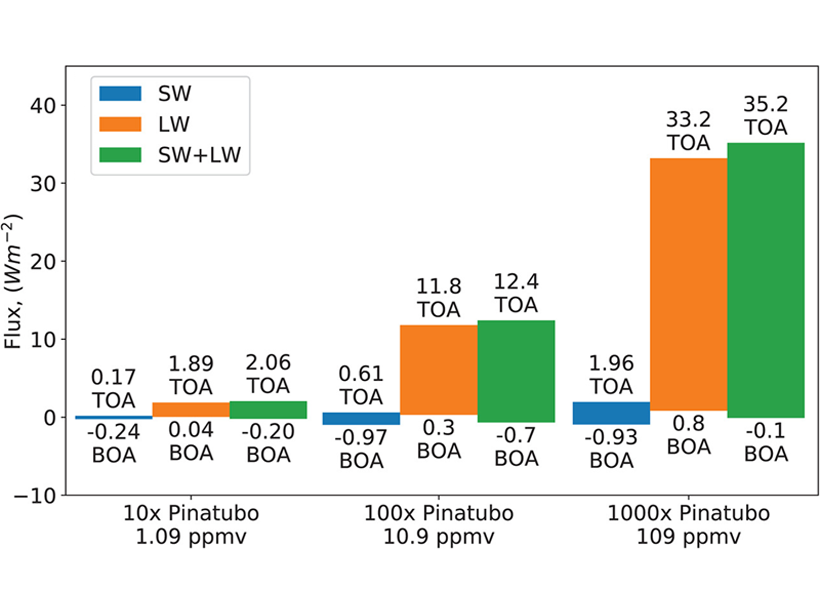
The Overlooked Role of Sulfur Dioxide Emissions from Volcanoes
Volcanoes can warm as much as they cool. Prior simulations have neglected the important warming effects of sulfur dioxide emissions, making some results colder than they should be.

Posted inEditors' Vox
Intensified Investigations of East Asian Aerosols and Climate
Three special collections in JGR: Atmospheres present a fast-growing body of literature on atmospheric aerosols and their impact on the regional climate in East Asia.