In the fluxART project, scientists using eddy covariance to study atmospheric flux partnered with artists to help communicate the “breath of the biosphere.”
arts
Posted inThe Landslide Blog
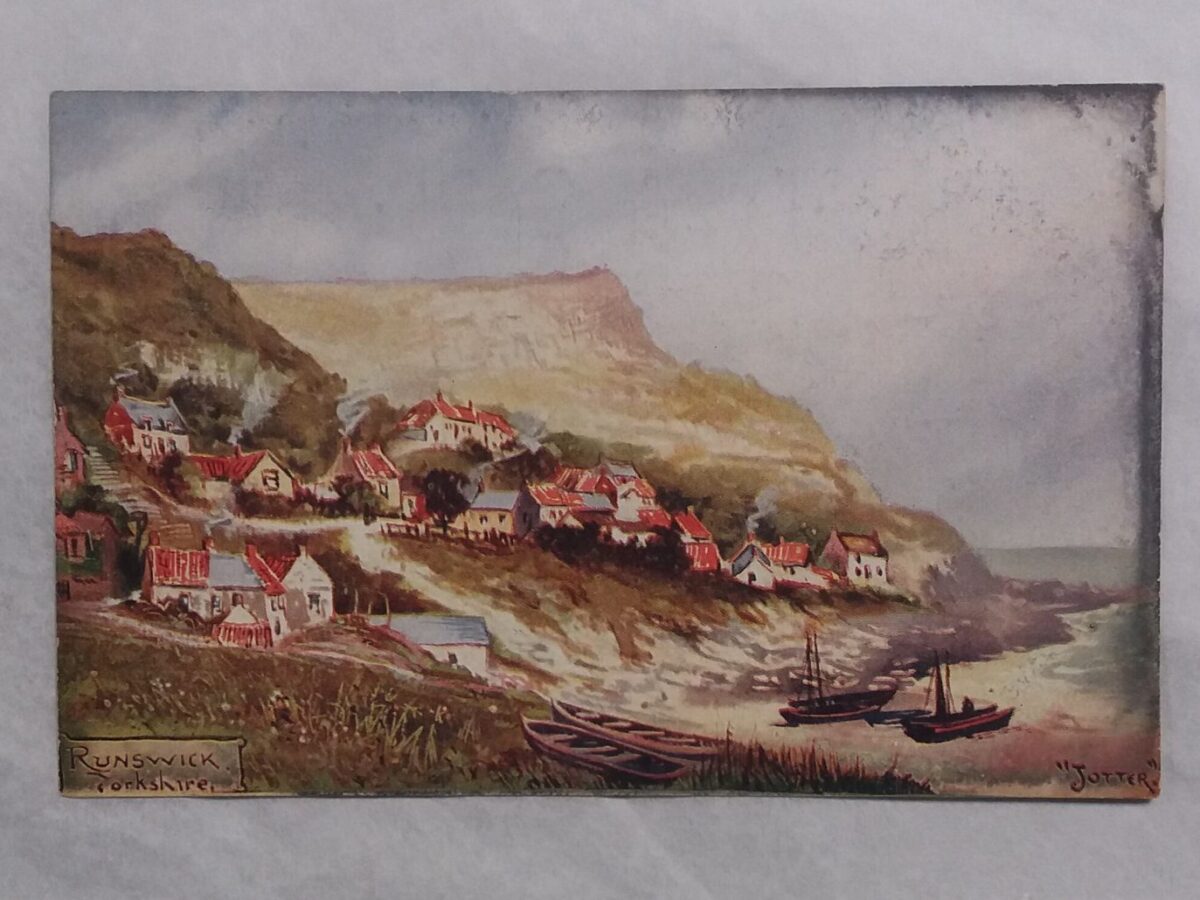
Landslides in Art Part 36: The Great Landslide of 1664 of Runswick Bay on The day Village That Slipped into the Sea by “Jotter”
The Landslide Blog is written by Dave Petley, who is widely recognized as a world leader in the study and management of landslides. I’ve not posted about Landslides in Art much in recent years – the most recent edition was almost two years ago – but loyal readers will know that this is a long […]
Posted inScience Updates
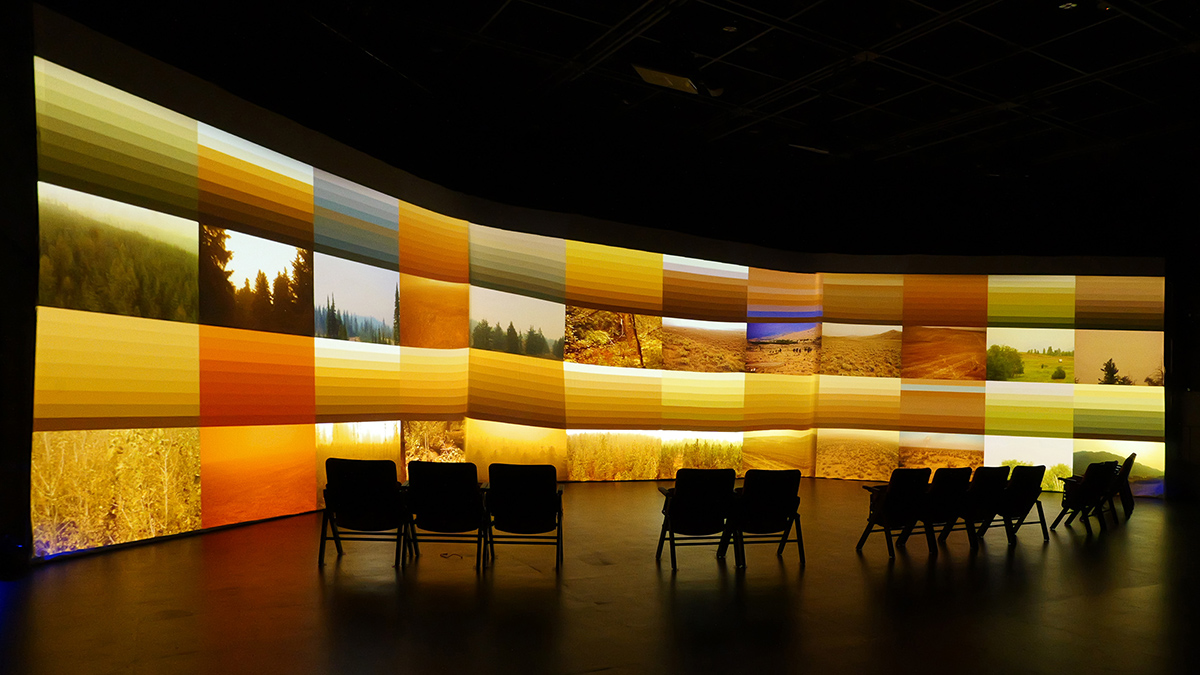
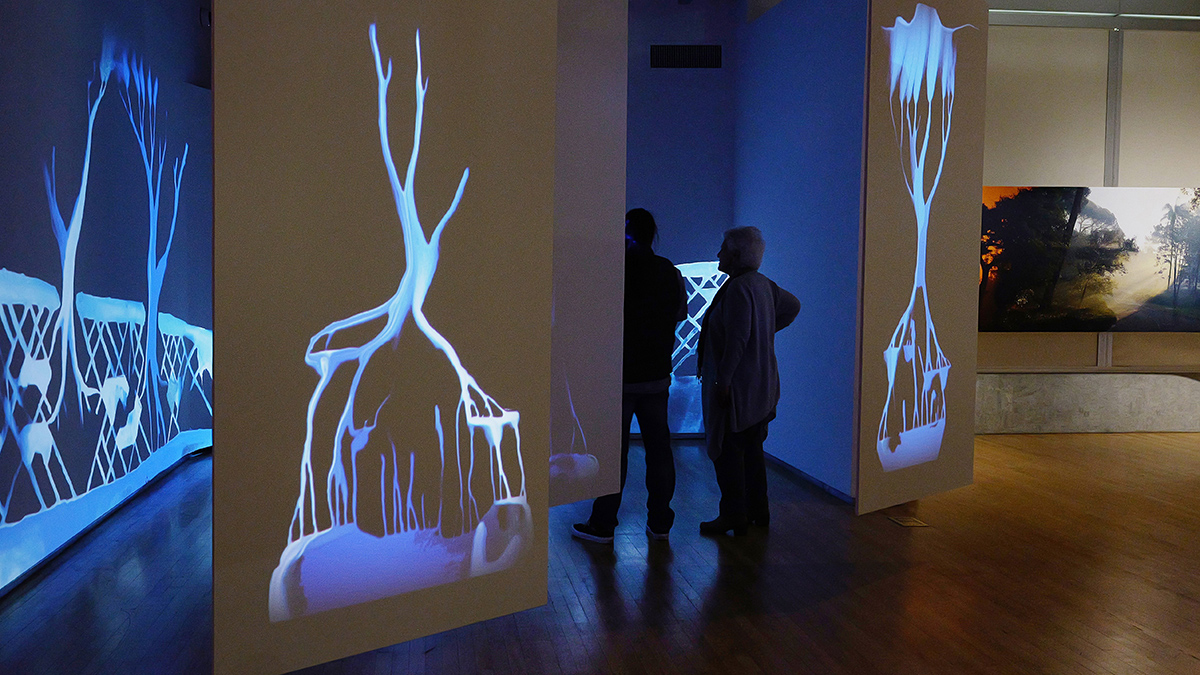
An Art-Science Partnership Offering New Views of Dynamic Landscapes
The immersive and interactive WILDLAND exhibition allowed the public—and the exhibition’s creators—to explore connections among water, trees, fire, and other natural and human-made materials expressed across a spectrum of artistic approaches.
Posted inResearch & Developments
Sculpture by Singer-Songwriter Jewel Incorporates Near Real-Time NASA Ocean Data
The soundscape changes in accordance with near real-time Atlantic Ocean conditions, as the data updates every 12 minutes. “If it’s raining, the piece looks and sounds different. If it’s stormy, the piece is different. It’s a living instrument that the ocean gets to play in real time,” Jewel said.
Posted inNews
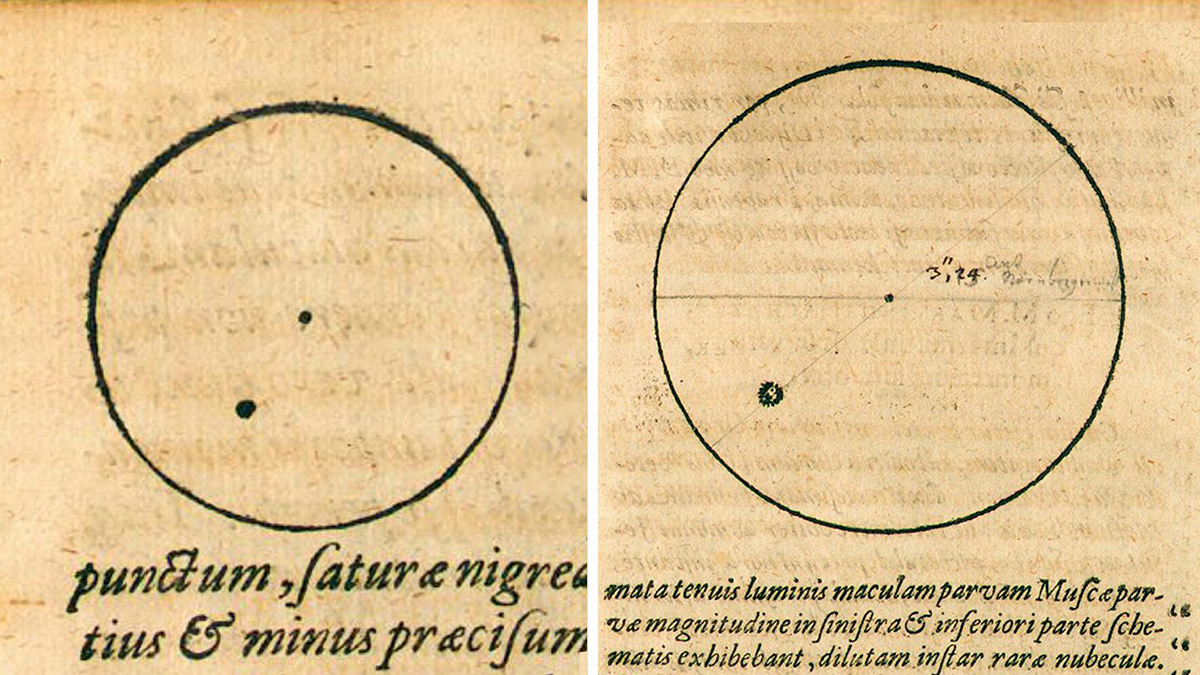
Sunspot Drawings Illuminate 400 Years of Solar Activity
A new computational framework is helping scientists sift through centuries of scientific illustration of the Sun’s spotty surface.

Posted inFeatures
Lucia Perez Diaz: Expressing Earth with Art
A geoscientist and illustrator finds artistic inspiration in plate tectonics and geodynamics.
Posted inFeatures
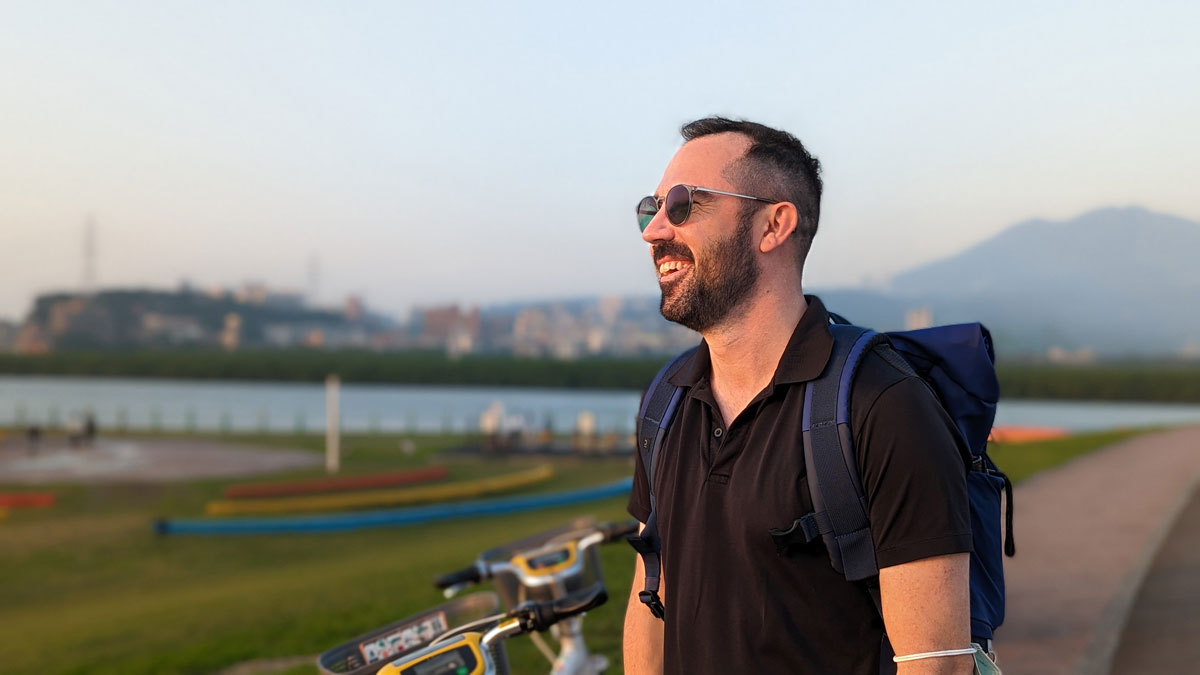
Alex Teachey: Elevating Astronomy with the Arts
This actor-turned-astronomer found success researching exomoons. Now he’s ready for another career change.
Posted inNews
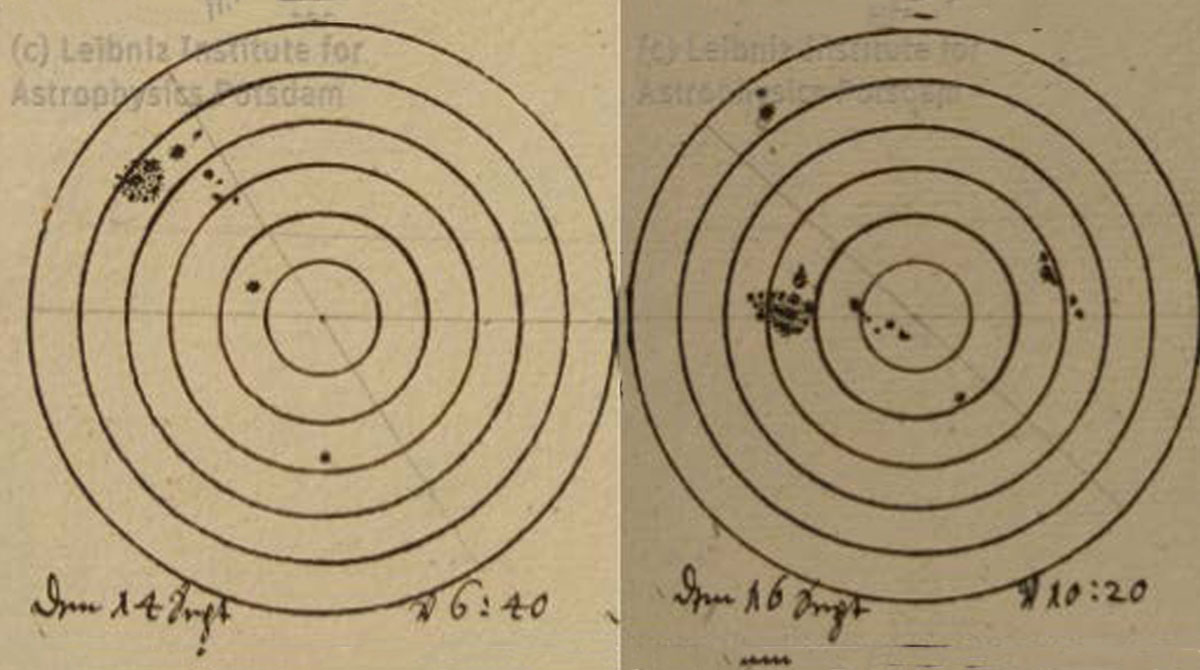
Kepler’s Drawings Might Reveal When the Sunspots Disappeared
Johannes Kepler’s landmark 1607 sunspot observations may have been made at the end of the solar cycle, helping constrain the start of the Maunder Minimum.

Posted inFeatures
Alexander Farnsworth: Finding Fact in Climate Fiction
A paleoclimatologist uses his modeling skills for both science and sci-fi.
Posted inEditors' Highlights
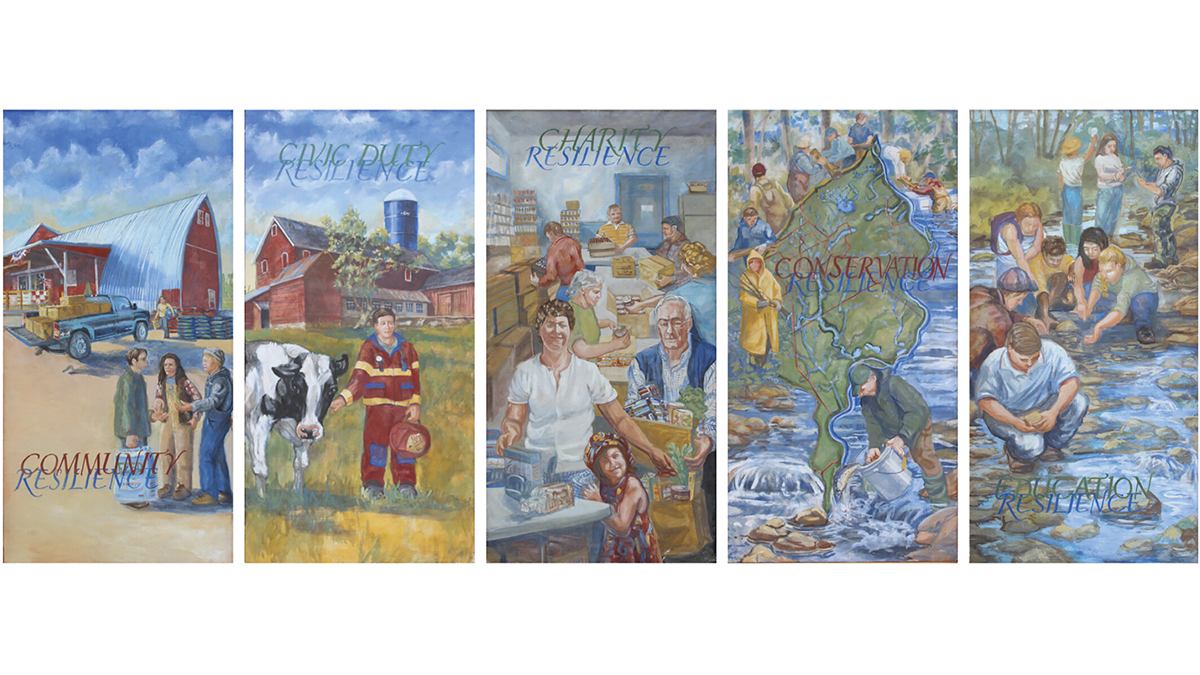
Integrating Science, Art, and Engagement to Strengthen Communities
The CREATE Resilience project is demonstrating how to engage communities to address natural risks by linking art and science.