Source: AGU Advances
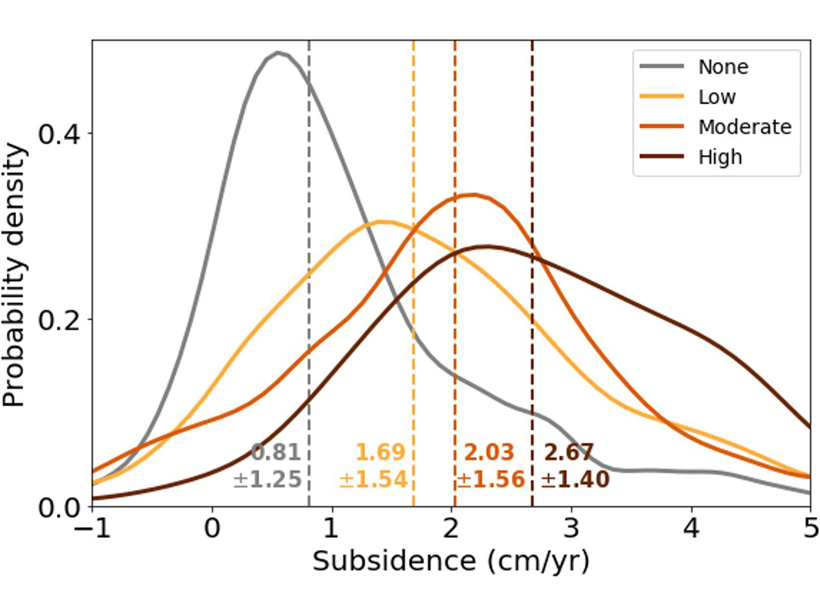
Dadap et al. [2021] use high-resolution satellite imagery to find that drainage canals modify 65 percent of peatlands in Southeast Asia, independently of land-use type. They link the acceleration of soil decomposition and carbon emissions to drainage density, which explains a three-fold increase in ground-surface subsidence rates in intensively drained areas. This study suggests that land-use-based parameterizations significantly underestimate carbon emissions from tropical peatlands and associated subsidence rates. They propose to remedy this handicap by accounting for drainage density.
Citation: Dadap, N. C., Hoyt, A. M., Cobb, A. R., Oner, D., Kozinski, M., Fua, P. V., et al. [2021]. Drainage canals in Southeast Asian peatlands increase carbon emissions. AGU Advances, 2, e2020AV000321. https://doi.org/10.1029/2020AV000321
—Ana Barros, Editor, AGU Advances
Text © 2021. The authors. CC BY-NC-ND 3.0
Except where otherwise noted, images are subject to copyright. Any reuse without express permission from the copyright owner is prohibited.